How does agricultural pollution affect estuarine health in the United Kingdom?by Sven Mellaza and Matia Pavkovic
Published by the October 4, 2021 on 4:39 PM
Estuaries are among the most productive ecosystems on the planet. These habitats deliver many services to humankind. They are characterized by wide ranges of water salinity, currents power and turbidity. To their natural stressors are added human disturbances that affect the natural system.
The rivers, from their sources to the sea, follow a long path through land fields. In a period of important rainfall, a large part of the land pollution defined by Nitrates and Phosphates is collected by the rivers and transported to estuaries. Consequently, the enrichment of the system modifies the relation equilibrium in the food chain; a rich and complex link between the organisms is the base of a healthy resilient ecosystem. The management application is crucial, so estuarine ecosystems can continue to deliver services and host rich life diversity.
Impact analyses of the pollution on the ecosystem
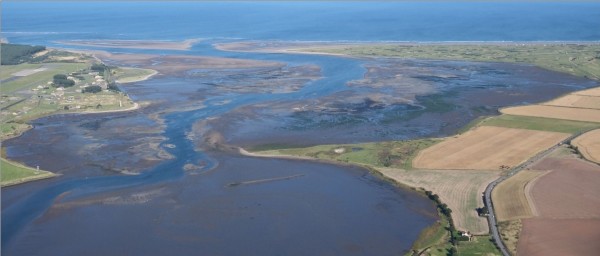
In this study, the scientist aimed to asses estuarine health by considering the relation between all the organisms. They have analyzed two estuaries systems from the United Kingdom. Tamara estuary is a medium-size complex located on the south-west coast of England; it stretches from Gunnislake weir to Plymouth sound. The second estuary, Eden, is smaller compare to the first one. It is positioned between the village of Guardbrige and the town of St Andrews on the East coast of Scotland.
Since the 90’s, the two ecosystems have experienced major nutrient enrichment from the arable and livestock production. This pollution led to the ecosystem “eutrophication”, a biological phenomenon that can cause an increase of algal bloom and a decrease of oxygen concentration in habitats.
For this research, ecologists are using mathematical software called “Ecopath model”. The model is a widely used tool to identify and quantify major energy flow in the ecosystem, to visualize the important interaction between species, evaluate pollution and climate changes in aquatic ecosystems. This approach allows them to examine systems in their entirety to adjust management application.
The aim of this study is to analyze and compare food network structure of these two estuaries at different historical period of nutrient concentration. The results shows that Tamar estuary is 25% more active than Eden estuary in periods of high nutrients concentrations. The activity is defined by the number of matters flowing in the system. The scientists explain here the difference by the greater size and greater freshwater inputs from the rivers in Tamar estuary. The second indicator was the total biomass of the estuary. The productivity of the system decreases with the reduction of nutrients enrichment. Primary producer’s growth is stimulated by the extra nutriments, which improve their development and finally impact the upper trophic levels.
During pollution event, flow of nutrients increases, leading to degradation of the food-chain organization and structure. In addition, wider the estuaries are, slower it recovers from perturbations, especially looking at the trophic structure.
The Ecopath, Ecosim and Ecospace models are tools primely used to evaluate ecosystem impact of fisheries (Pauly et al. 2000). As it gets popular, these models are useful to evaluate trophic systems like estuaries. These well-known models can be useful to predict and analyze the effects of actual global changing. Nevertheless, a bunch of other models exist and are used to analyze trophic system like Bayesian-mixing model. Using different tools to study the same problematic permit comparison and can lead to different approaches.
Pyramids, built by the Egyptians and reversed by sharksby Pierre Labourgade, Valentin Santanbien and Morgan Schler
Published by the October 5, 2020 on 8:28 AM
The case of a extreme inverted trophic pyramid of reef sharks supported by spawning groupers in Fakarava, French Polynesia
Predators play a key role in the structure and functioning of ecosystems (Paine 1966; Begon et al. 2006). Through food webs, the relationship between preys and predators is crucial in order to maintain a balance, including in marine ecosystems (Woodson et al. 2018). A trophic pyramid is a graphic representation designed to show the biomass at each level of the food chain. The lowest level starts with decomposers and the pyramid ends with top predators. This is called a pyramid because generally, the biomass in the lower levels turns out to be much higher than in the upper levels (Figure 1 A). However, in the marine environment, and in some remote and almost unoccupied areas, predators may dominate in terms of biomass, generating an inverted pyramid (Figure 1 B).
Figure 1 Diagram of a normal (A) and inverted (B) trophic pyramidAggregations of grey reef sharks, Carcharhinus amblyrhynchos are observed on some reefs in the Indo-Pacific (Robbins 2006) (Figure 2). The southern pass of Fakarava atoll in French Polynesia has a population of around 600 individuals of this species (Mourier et al. 2016) (Figure 3). This makes it one of the few places to present such a large grouping. With such a large population on a reef channel of just over 1 kilometer, the area has up to three times the biomass per hectare documented for any other reef shark aggregation (Nadon et al. 2012). The biomass of predators is then much greater than preys, thus generating an inverted trophic pyramid. During this study, scientists tried to understand how those large group of sharks can survive when prey biomass is insufficient.

Figure 2. Aggregation of grey reef sharks
Figure 3. Panoramic view of Fakarava atollDuring the study period, video-assisted underwater visual surveys conducted across the pass allow the researchers to find that sharks population can represent up to 700 individuals. Then, scientists use bioenergetic models based on known value of parameters that influence energetics needs of shark-like “asymptotic length”, “growth rate” or “proportion of fish in the diet” to determine prey biomass needed for all the individuals. According to bioenergetic models, the food requirements to maintain that large population is approximately 90 tons of fish per year, which is not provided by the environment as it is. However, the pass is used as a breeding ground for many fish species, thereby reducing the prey-shark ratio. This means that the prey biomass will be much higher than that of sharks during these reproduction periods (Mourier et al. 2016), leading to frenetic predation behavior in the shark that will allow it to meet its energy needs (Robbins and Renaud 2016; Weideli, Mourier, and Planes 2015). Furthermore, the continuous presence of prey aggregation is ensured by the successive migration of different species to this site, in order to meet the metabolic demands of the shark population present (Craig 1998). With simulation-based on researcher bioenergetic model, sharks would not have enough energetic income after 75 days if other prey species didn’t migrate to the pass. There is, therefore, an idea of metapopulation where the exchange of individuals between populations in normal and inverted trophic pyramids ensures that the energy needs of each individual are met (Figure 4). This exchange of individuals between populations will allow the long-term maintenance of the species and, in the case presented here, of the shark.
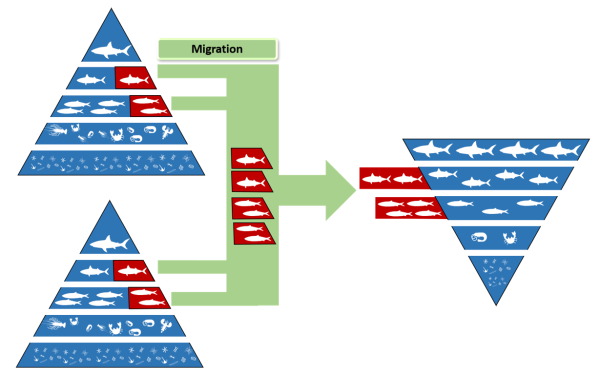
Figure 3. Diagram of the transfer of potential prey for the shark between two normal pyramids and one inverted trophic pyramid via migratory flowsThe temporal aspect in the movement of individuals between populations is therefore important to be considered during the development of management and conservation measures. Indeed, if we want to ensure the sustainability of the grey reef shark in this pass, we must not only protect the habitat on-site, but also the original habitat of different species that come to reproduce in the pass. These species are indeed essential for the survival of sharks since they represent the only source of energy available during certain periods of the year.
Other cited articles:

This post is licensed under a Creative Commons Attribution-ShareAlike 4.0 International License.Microplastics: no effect on the productivity of the marine environment?!by Amaelle Bisch and Anaelle Bouloy
Published by the July 6, 2020 on 2:45 PM
According to the paper: “Do microplastics affect marine ecosystem productivity?” by Troost et al. 2018, microplastics would have almost no effect on primary and secondary production, or at least this effect could not be demonstrated!
 But what are microplastics?
Plastics appeared at the beginning of the 20th century and quickly became indispensable in everyday life. Plastics are composed of polymers (long carbon chain) of synthetic or natural origin. Microplastics are plastic particles smaller than 5 mm (. There are two types of microplastics: primary (directly manufactured at this size) and secondary (resulting from the degradation of macroplastics). The major disadvantage of microplastics is that they are easily ingested by marine biota (2,3).
Primary production, the basic link in a long chain
Primary producers are at the base of the trophic chain. They are autotrophic organisms that produce their organic matter from a light (photosynthesis) or mineral source. In the marine environment, these organisms correspond to algae, phytoplankton and cyanobacteria and are the basis for zooplankton feeding. Zooplankton are secondary producers and heterotrophic organisms unable to synthesize their organic matter.
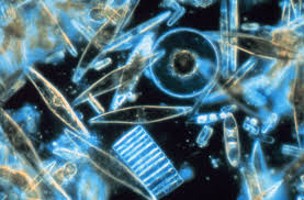
Phytoplankton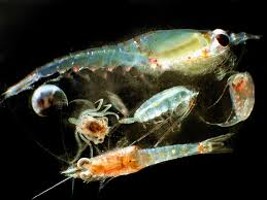
ZooplanktonHow can microplastics affect these organisms?
In most of laboratory experiments, the impacts showed on plankton, they were for primary producers an inhibition on the algae growth, chlorophyll content and photosynthesis (4,5,6). For zooplankton, it was observed a reduced food consumption and an increasing in energy consumption with a low allocation of this energy for growth (7,8). But these effects depend to the species of plankton and the nature of microplastics (9). However, are these observations noted in the laboratory really transposable to the ecosystem scale?
The models spoke...
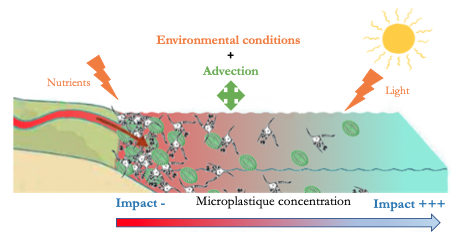
The study by Troost et al. (1) shows, by means of modelling, that at the level of primary production (algal biomass) there is no significant impact of microplastics. Indeed, this can be explained by different theories: (i) environmental conditions (availability of nutrients and light) already strongly impact the growth of algae, (ii) a transport technique (advection) would provide some protection.
Concerning zooplankton, or secondary production, the impact of microplastics is considered low over the entire North Sea because the observed changes are both positive and negative and therefore compensate each other. Exposure to microplastics leads to changes in spatial patterns and strangely enough the impact is not greatest in areas with the highest concentration of microplastics. Surprising but not so much because this can be explained simply by the small concentrations of algae found in off-shore areas (areas with the least concentration of microplastics) making zooplankton more sensitive to any change.
And how they have managed to demonstrate that?
The difficulty lies in a successfully integration of the data observed in the laboratory into an ecosystem-scale model. They modelled biogeochemical transport, hydrodynamics, nutrient inputs from rivers, primary production, zooplankton biomass and also microplastic concentrations in the North Sea. In the end, the results obtained are only based on modelling and could not be verified in the field, so the conclusions should be "swallowed" with caution.
Cited articles
- Troost, A., Desclaux T., Leslie, A., Van Der Meulen, M., Dick Vethaak, A., 2018. Do microplastics affect marine ecosystem productivity? Marine Pollution Bulletin 135 (2018) 17–29
- Ivar do Sul, J., Costa, M.F., 2014. The present and future of microplastic pollution in the marine environment. Environ. Pollut. 185, 352–364. http://dx.doi.org/10.1016/j. envpol.2013.10.036.
- GESAMP, 2016. Sources, fate and effects of microplastics in the marine environment: part two of a global assessment. In: Kershaw, P.J., Rochmann, C.M. (Eds.), IMO/FAO/ UNESCO-IOC/UNIDO/WMO/IAEA/UN/ UNEP/UNDP Joint Group of Experts on the Scientific Aspects of Marine Environmental Protection. Rep. Stud. 2016pp. 220 GESAMP No. 93.
- Zhang, C., et al., 2017. Toxic effects of microplastic on marine microalgae Skeletonema costatum: interactions between microplastic and algae. Environ. Pollut. 220, 1282–1288.
- Sjollema, S.B., et al., 2016. Do plastic particles affect microalgal photosynthesis and growth? Aquat. Toxicol. 170, 259–261.
- Casado, M.P., et al., 2013. Ecotoxicological assessment of silica and polystyrene nano-particles assessed by a multitrophic test battery. Environ. Int. 51, 97–105.
- Watts, A.J., et al., 2015. Ingestion of plastic microfibers by the crab carcinus maenas and its effect on food consumption and energy balance. Environ. Sci. Technol. 49, 14597–14604.
- Van Cauwenberghe, L., et al., 2015. Microplastics are taken up by mussels (Mytilus edulis) and lugworms (Arenicola marina) living in natural habitats. Environ. Pollut. 199, 10–17.
- Wenfeng Wang, Hui Gao, Shuaichen Jin, Ruijing Li, Guangshui Na, 2019. The ecotoxicological effects of microplastics on aquatic food web, from primary producer to human: A review. Ecotoxicology and Environmental Safety 173, 110–117

This post is licensed under a Creative Commons Attribution-ShareAlike 4.0 International License.A new approach of modeling dissolved organic matter release by phytoplankton. Is it an improvement?by Bastien Mourguiart and Thomas Panarotto
Published by the April 12, 2019 on 6:53 PM
Phytoplankton is playing key roles in marine ecosystems. These microscopic plants are known, in particular, to be a part of the “Biological Pump”. Using photosynthesis as metabolism, it fixes carbon of the atmosphere to produce energy. This process reduces atmospheric concentration of CO2 and limits the greenhouse effect. It also produces oxygen indispensable to the life of many organisms.
Phytoplankton forms the basis of the marine food chain. Autotrophic organisms, they convert sunlight energy into chemical energy (food). This food constituted by molecules with carbon (organic matter) can pass directly along the food chain when zooplankton eats the phytoplankton and in turn are consumed by larger animals such as fishes, whales, squids, shellfishes and birds. Organic matter (OM) can also be released by phytoplankton in a dissolved form named dissolved organic matter (DOM). Organic matter can then be absorbed by bacteria and enter the main food chain when bacteria are eaten by zooplankton.
Heterotrophic prokaryotes (all animals) use carbon contained in DOM as a major source of energy. So, products excreted by phytoplankton are really important in the functioning of marine ecosystems and understand how DOM is released in the environment is essential.
Livanou et al. present in their article “A DEB-based approach of modeling dissolved organic matter release by phytoplankton” a new model to calculate DOM release by phytoplankton. They apply Dynamic Energy Budget (DEB) theory on phytoplankton cells for that. In this study, the metabolism theory leads to describe DOM fluxes, based on assumptions about energy uptake, storage, and utilization of N and C. The authors are mainly interested in how DOM is excreted by phytoplankton under different nitrate concentrations.
They calibrate and test the goodness of fit of the model using past laboratory data. In this previous experiment, others scientists (Flynn et al. 2008), measured DOM released by one species of phytoplankton with two phase of nutrient concentration: one with enough nitrate for all the individuals and one with nitrate in limitation. The results of DEB-Model fit well to experimental data according to Livanou et al. even it does not explain all the information: in the figure below, lines (the model) do not fit exactly the points (experimental data).
Figure 2 in Livanou et al.To conclude, they explain quickly that their model permit to describe how DOM is released. In no N-limitation condition, passive mode is used and DOM excreted is more accessible for bacteria. For N-limitation condition, DOM released cannot be used by bacteria and it tends to accumulate.
This study is maybe a step forward in comprehension of phytoplankton physiological mechanisms. However, in our opinion, it is not really useful to improve our understanding of energetic flows in the oceans. Moreover, the model was calibrated for only one of the thousand species of phytoplankton existing in nature. It should be calibrated for others species to catch up more processes which can change between species. The model can be more accurate catching up all the processes in this particular species too: the fitting test shows some differences from the experimental data (Figure 2). There is also limiting by the fact that only one nutrient is used as limiting nutrient: in reality, there can be more (Moore et al. 2013). To summarize, it needs very lot of work on this model to employ it in real ecosystems and be an improvement.
Other references:

This post is licensed under a Creative Commons Attribution-ShareAlike 4.0 International License.


