


How raising snails allows to better understand the dynamics of a parasite?by Thomas Boyer and Thibault Dindart
Published by the July 19, 2021 on 9:38 AM
The analysis of epidemiological dynamics depends on host and parasite interactions. But these interactions fluctuate because hosts and parasites are heterogeneous entities that exist in dynamic environments. Resource availability is a powerful environmental constraint of intra-host infection dynamics (temporal patterns of growth, reproduction, parasite production and survival).
In this study, researchers developed, parameterized and validated an explicit resource infection dynamics model by incorporating a parasitism module in the energy balance theory. The mechanisms explained are the multivariate dynamic responses of the human parasite Schistosoma mansoni and its intermediate host snail to resource variation and host density. This parasite is widespread in Africa and inter-tropical America. Worldwide, more than 200 million people are infected with it, 9 million suffering from its symptoms, which cause more than 200,000 deaths every year. It tends to have erratic localizations (liver, spleen) and the accumulation in these organs of lost eggs makes the severity of the infection.
The most common symptoms are diarrhea and even dysentery. Complications can appear such as rectal prolapse, fistulas, occlusion, appendicitis.
To do this, they have parameterized the model using an experiment that manipulates food resources and follows the growth, reproduction, parasite production and survival of snail hosts. The model is then validated by simulating the dynamics of infection for host individuals undergoing different levels of intraspecific competition and comparing these predictions with the results of another experiment that manipulated host and resource density, and hence the intensity of resource competition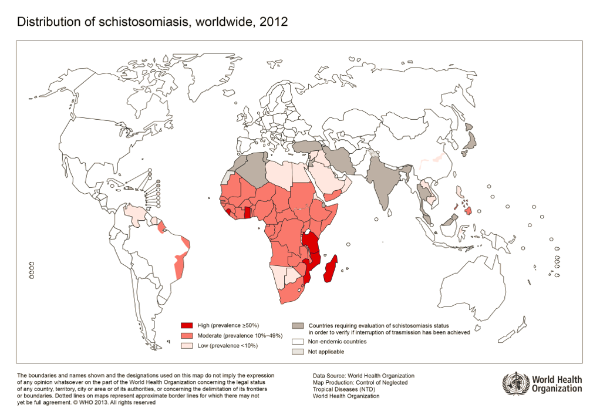
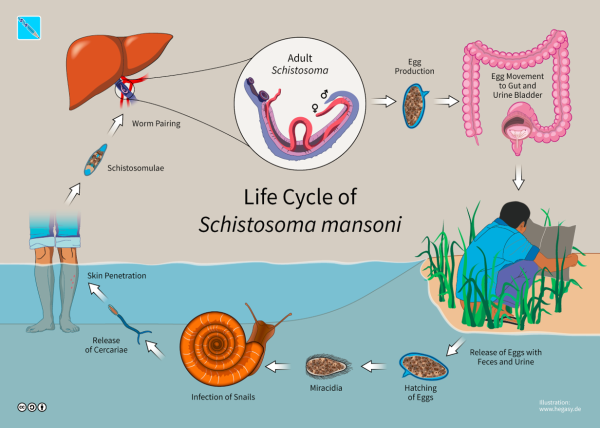
This bioenergy perspective suggests that variation in resource availability and competition could explain the infective dynamics of this parasite. To begin with, total cercaria production could be low when snail densities are low (because there are few infected snails) or when snail densities are high (if competition limits per capita parasite production). This potential relationship between snail density and the risk of human exposure could be the reason for the success or failure of current and proposed methods of schistosome control, which depend on reducing the density of snail vectors by molluscicides or predators. If resource competition in natural snail populations is strong enough, then snail reduction programmes could backfire, as reducing intermediate host densities could free the remaining hosts from resource competition, thereby increasing parasite production rates per host.
To conclude this bio-energetic model seems to indicate that the fight against the parasite Schistosoma mansoni begins with the regulation of snail populations (first host of the cycle). In order to better regulate this infectious dynamics, measures must be taken collectively between the countries concerned and must be directed towards a total reduction of snails or a limitation by intra-species competition. This model would establish priority levels of parasite infection for certain areas and would be followed by measures to control the parasite. A first measure would be the installation of pipelines to prevent the release of infected faeces into watercourses.
This post is licensed under a Creative Commons Attribution-ShareAlike 4.0 International License.A new way to understand the effects of toxic compoundsby Flore Emonnot and Anne Michaud
Published by the September 7, 2020 on 8:07 AM
Water pollution is a major concern. It can be induced by many elements. For example, Cadmium (Cd) which belongs to the heavy metals family can be source of pollution in certain concentrations. This element is naturally present in the environment, but the use of agricultural chemicals has been indicated as the main anthropogenic source of Cd pollution in aquatic environments. The organisms living in these aquatic ecosystems are exposed to this pollution. Moreover, this compound is bioaccumulated in organs and tissues, so it can induce damages.

Daphnia magnaThat is why it is important to evaluate the effects of this pollutant on organisms. Daphnia magna (a cladoceran crustacean) is one of the most widely used animals in aquatic toxicology. In terms of sensitivity to toxic substances, it is generally thought to be representative of other zooplankters (Anderson, 1944). It plays an important role in the balance of an ecosystem, because of its position on the first levels of the food chain. Also, D. magna enhances water purification by filtering water and retaining food particles, it is its way to eat. This animal spends its whole life in a variety of freshwater environments. As long as the conditions remain favourable, it reproduces predominantly by parthenogenesis.
Bioassays are used in aquatic toxicology to provide individual-level information, while ecotoxicology is assessing the impact of pollution on populations. The DEB theory (Dynamic Energy Budget) is a theory that describes the aspects of metabolism (energy and mass budgets) at the individual level. Food assimilation results in energy, which can then be used for reproduction, growth or maintenance (life-history traits). The DEBtox is a toxicological application of the DEB theory which attempts to assess the effects of pollutants on life-history traits over time.
The key challenge is how to infer the impact of toxic effects observed in individuals and apply it to an entire population. Elise Billoir and her team combined the following tools to extrapolate the individual effects to the entire population:
The DEBtox is a good way of modeling survival, reproduction and growth continuously as a function of time and exposure concentration and at the individual level.
The population growth rate (which incorporates lethal and sublethal effects), is the best parameter to evaluate the risk of a pollutant on a population, hence matrix population models are a useful tool. Billoir explains that in population matrix, population is divided into classes based on development stage, and individuals transfer from a class to the next one depending on their survival and their fecundity.
By combining DEBtox theory and matrix population models, it is possible to extrapolate every effect of the toxic compound on the individual to the population level (as explained in the synthetic diagram below).
This technique used by Billoir, has not yet been used in an ecotoxicological context. It consists of reorganizing all the age-specific information in a stage-specific way. This way it makes possible to compare the sensitivity in the face of cadmium and in relation to the age of the individual.

Diagram of the method developed in the study of Billoir et al.In this case, the sensitivity analyses showed that the effects of cadmium at the individual level were not significant but the application of the model proved that the population growth rate is highly affected through the cadmium contamination. Moreover, we think that this model could be applied to similar aquatic organisms and other pollutants such as heavy metals and could be useful to enhance existing bio-indicators of water quality.
This post is licensed under a Creative Commons Attribution-ShareAlike 4.0 International License.Spatial response of plaice and sole to climate changeby Arnaud Dupond and Alix Pascal
Published by the August 3, 2020 on 7:54 AM
Scientists admit that climate change is one of the main driving forces which change species distribution and abundance in many ecosystems.
In this case, a modification of abiotic variables can affect the “niche concept” and can also change species geographical distributions. For the marine environment, this notion of geographical dependence is important. Indeed, marine organisms show several distinct stages during their life and each of these stages evolve in a specific habitat.
The objective of this study was to use different models based on physiological aspects and environmental variables in order to estimate habitat occupation by plaice and sole under different climate change scenarios in the North Sea.
How to reach this objective?
To predict new habitats, researchers considered environmental variables and determined their effect on the food web, but also the effect of the food web on the water chemistry. To do that, the ecosystem model used functional groups of taxa. Their taxa are phytoplanktonic, planktonic and macrobenthic organisms. Some of them have a direct effect on the water chemistry and are regulated by other taxa. The food web is also used to quantify the availability of the habitat’s resources. Thanks, of this two types of model results fit more precisely reality of the distribution.
The sample strategy is built like this, data are collected daily on surface of 10x10km sin the North Sea.

Figure 1: Schematic simplification of the models used in the studiesResults of the study
The model of environmental variables shows the predictions for temperature and food conditions between 1989 and 2002. This data showed benthic production is concentrated along the southern coast during the year 1989, whereas in 2002 is concentrated in the Southern bight (figure 2).

Figure 2: Comparison of the benthic production between 1989 and 2002 in the North SeaAn important fact is that the temperature rate inside of which the growth is positive will change with the size of the fish and according to abundance of food (the more food is abundant the higher rate of temperature is). Indeed, bigger fish need higher temperature to grow optimally. Figure 3 defines the areas of maximum potential daily growth of each class size of plaices in 1989 at the left, and in 2002 at the right.

Figure 3: Comparison between the three size ranges of plaices and soles, of the speed growth in regard of two environmental parameters, the food availability and the temperatureThe results for maximum potential growth per day seem to give the same result as the estimate of average abundance. (Figure 4).

Figure 4: Comparison of the plaice and sole abundance distribution in the North SeaConclusion
For the plaice, migrations during different stages of life maximize their physiological performance during the summer season, in the winter, the adult’s distribution is determined by the best spawning habitat and shows maximisation of their fitness. Sole differs in their physiological traits and have a higher optimal growth temperature which explains the difference in life habitat. As for plaice, the area indicated high quality habitat for the different size class.
This study can predict the evolution of species distribution with a model of environmental changes and one of physiological changes but in our case, we can just explain data collected not the prediction made with the model.
Read the full study: Teal, L.R., van Hal, R., van Kooten, T., Ruardij, P. and Rijnsdorp, A.D. (2012), Bio‐energetics underpins the spatial response of North Sea plaice (Pleuronectes platessa L.) and sole (Solea solea L.) to climate change. Glob Change Biol, 18, 3291-3305. https://doi.org/10.1111/j.1365-2486.2012.02795.x
This post is licensed under a Creative Commons Attribution-ShareAlike 4.0 International License.


