


Oysters with a plastic flavor in your plates for your celebrations!by Léa Bascoul, Vincent Dumontet and Sophia Lestringuez
Published by the November 8, 2021 on 5:52 PM
For over half a century, global plastic production has increased exponentially. Plastics represent 50% to 80% of marine litter. Microplastics (MP) are derived from the degradation of larger plastic articles or directly produced as microparticles (< 5 mm). Oceans have a “funnel” effect concerning MP drained from rivers and streams, they concentrate pollution from fresh waters in the oceans. In pearl farming structures and equipment, the use of plastics is a source of pollution to the detriment of the lagoon ecosystem. Due to their ubiquitous and small dimensions, MP are likely to be ingested by many organisms and in particular by the oyster, Pinctada margaritifera (Figure 1), which is a species of ecological and commercial interest. So, the objective of the study is to assess the impact of these microplastics on the physiology of this oyster species from the pearl lagoon of Ahe atoll, in the waters of French Polynesia (Figure 2).

Figure 1: Pinctada margaritifera
Figure 2: Ahe atoll localisationIn order to assess the effects of these molecules, IFREMER from French Polynesia, recreated microcosms [1] where oysters are exposed to polystyrene microbeads. Indeed, polystyrene is one of the most widely used plastic polymers and the most found in marine ecosystems.
After two weeks of depuration, oysters, were divided into three treatments. For each, 24 oysters were exposed to polystyrene solutions for two months. These solutions were a mixture of polystyrene microbeads of different diameters (6 and 10 μm) at equal weight. A control was carried out without exposure to polystyrene. Each tank, kept homogeneous, was exposed for 12 hours a day to light and the physico-chemical parameters were kept constant. The microplastic solution was injected continuously into the tanks associated with a mixed diet of two microalgae (Tisochrysis lutea and Chaetoceros gracilis).

Figure 3: Experimental exposure device of oysters to microplasticsDuring the experiment (Figure 3), various parameters, like oxygen consumption, were measured to assess the different energy expenditure of the oyster. Expenses related to food (ingestion rate and assimilation efficiency), to growth (the scope for growth defined from the energy budget and the shell growth rate) as well as those allocated to reproduction (characterization gonad [2] size and analysis of gametogenesis [3]) are quantified in each experimental group and compared to the control. The measurements were carried out on eight oysters per treatment after one month and then at the end of the experiment.
This experiment made it possible to demonstrate that at low MP concentrations, pearl oysters suffer adverse consequences for the sustainability of their populations. In fact, the metabolic responses of a stressed organism can lead to an increase in an individual's energy costs, forcing the organism to sacrifice some of its energy normally allocated to functions, such as growth or reproduction.
In this classical and standardized experiment, the oysters exhibited a significant dose-dependent reduction in the “scope for growth” without however modifying the shell deposit rate. On the other hand, although the ingestion rates of the microalgae were not affected by the microplastics, for an equal volume of filtered water the assimilation of the microalgae is disturbed by the presence of the microplastics and the energy supplied by food is lower. This is either linked to interference in assimilation processes in the digestive tract or to indirect competition between algae and microplastics.
The fact that metabolic (respiration) rates are not impacted suggests that the only possibility for the oyster to cope with a decrease in available energy is to modify its gametogenesis and / or its reproductive effort. However, reproduction in P. margaritifera is continuous and requires a lot of energy. The results of the study show that reproductive effort is not affected but that gametogenesis is strongly impacted. Thus “small holes” in the gonadal tubules [4] are observed in oysters exposed to microplastics. They could therefore be the start of the phagocytosis [5] of germ cells initiated to recover energy (Figure 4).

Figure 4: Impact on P. margaritifera metabolismIn a few words, the pearl oyster exposed to MP for a period of two months maintains its metabolism and its vital functions to the detriment of its reproduction, and therefore the sustainability of its future population.
This study could also serve as a model for the MSFD [6] Technical Group Marine Litter to assess the effects of microplastic litter in biota (D10C3), because the effects observed on Pinctada margaritifera in the lagoon of French Polynesia must be the same as on other filter feeding bivalves in Europe. The European Technical Group Marine Litter could thus propose a regulation of waste at the European level and not only at the level of the lagoon of French Polynesia.
The experiment results should support decision-making on plastic waste management measures in Polynesian lagoons, especially in atolls that have decades of pearl culture history without waste regulation or clean-up. This work would provide the necessary information to local authorities to regulate pearl equipment and establish a waste management policy such as the collection and recycling of this equipment.
The aim of the study was to measure the impact of microplastics on the metabolism of Pinctada margaritifera. The team of researchers therefore sought to artificially recreate different levels of pollution in the laboratory. This methodology is suitable because it aims to recreate the pollution conditions possibly encountered in natural environments. To measure these different levels of pollution, the experiment is carried out at different concentrations. As for the various parameters measured to assess energy losses, they make it possible to identify, in a non-invasive manner, the functions (growth and reproduction) "sacrificed" to cope with the loss of energy. They also allow us to see if this loss of energy had an effect on the metabolism of oysters. The parameters monitored therefore seem consistent for this study and could be used for similar studies on other bivalve filter-feeding organisms. Experiments using this protocol could be considered in fresh waters with other types of bivalves such as the mussel pearl (Margaritifera margaritifera). Also, this study can be evaluated with a direct approach on oysters from pearl farms and over several generations.
In several years, oyster populations on a global scale could be impacted by pollution from microplastics … so, if there are no more oysters, what will we eat with our white wine?
[1] smaller version of ecosystem
[2] an animal organ in which gametes (a haploid germ cell, such as a spermatozoon or ovum) are produced
[3] gamete formation process
[4] organs of gametes excretion
[5] cellular defense process, destructive function of phagocytes
[6] Marine Strategy Framework Directive

This post is licensed under a Creative Commons Attribution-ShareAlike 4.0 International License.Help! How do I manage my commercial oyster nursery?by Coline Arqué, Marylou Pourret and Robin Thibault
Published by the September 6, 2021 on 4:16 PM
Evaluation of food limitations in commercial oyster nurseries: an aid for managers
Oyster production provides an important number of ecosystem services (nutrient cycling, providing habitat for other marine species, ...). Furthermore, shellfish farming is promoted and recognized as providing social and economic benefits, as well as ecological benefits. Oyster growth and production depends on several factors such as temperature, salinity, freshwater flow/rainfall, current speed, density, feed concentration and phytoplankton species composition, feed sharing with other species and disease outbreaks. For this reason, modeling can be useful in understanding the feedback between agricultural and environmental systems and the effects on production. Mass balance models can help estimate the food requirements of a given spat stock.
Objectives:
- Develop and evaluate model for different culture structures using Pacific oyster spat
- Make the model available online for wider use
- Ensure it tackles two questions that arise when planning or managing an oyster nursery: how much food is required to sustain a given stock and for a typical range of food available in the surrounding environment, what is the maximum biomass that can be stocked
Why use the Pacific oyster?
")
Crassostrea gigas (Thunberg, 1793)- Strong Economic Interest: 4.4 million tons in 2003 (FAO)
- The cultivation is well suited: to small family businesses, cooperatives or regional industry
- The grow-out phase can be carried out by: relatively unskilled labor with minor investment in equipment and infrastructure
The overall goal of this model is to estimate the food inputs for a given stock biomass; and the maximum stock biomass for a given external food concentration.
Different parameters were considered in this model relied on the experiences of Langton and McKay (1976) ...
Level of food supply
Simulations of two feeding levels with an interval of 6 hours:
- Exp A : Exp A: daily intake of 180 algae cells/μL x 250 L of tank
- Exp B: 120 algae cells/μL x 250 L of tank
In addition, to mimic the experimental setting, the model application includes only one class of oysters, so that at each run of the model, the spat size is set to the same size obtained from the weekly observations of Langton and McKay (1976) for the 6:00/6:00 regime.
[Food]Nursery
Key parameter used in the model as the optimal concentration to be maintained in the production unit. [Food]nursery: minimum dietary concentration that maximizes intake OR optimal concentration for growth.
Temperature
Chosen according to other references on the subject. The temperature for the maximum clearance rate is approximately 19°C. Thus, the lower limit of the model is set at 4°C and the upper limit at 30°C.
The biomass of the stock was calculated by considering the density of 50 spat per liter, multiplied by the volume of the tank (250 L) and by the size of the seeds.

Conceptual model for the oyster nursery.The choice of a model that takes several parameters into account allows a rendering close to reality. This application is a useful tool for managers who can limit as much as possible the costs that are not essential for the good development of a species. Indeed, the aquaculture environment is a field with high socioeconomic stakes. Therefore, it is useful in the long term to find new management concepts for sustainable resource management.
RESULTS
Week 0
Week 2
Week 3
Following weeks
Exp A
Exp B
Exp A
Exp B
Exp A
Exp B
Feed supplied is much higher than the stock requirements
Feed level supplied is still enough
Oysters are fed less than the optimum
Feed level supplied is near the threshold
Feed level supplied does not meet the needs of oysters
lower spat weight for experiment B than for experiment A
These different growth rates measured in Exp A and B (Langton & McKay 1976) confirm the model's predictions of dietary limitation. The results of the model are also consistent with those of Langton and McKay (1976), which predicted that oyster spat are not diet-restricted during the first two weeks. The model outputs provide the feed requirements to ensure minimum concentration in the nursery. It also gives the maximum biomass that can be stored to ensure a minimum concentration in the nursery for optimized growth.
ASSISTANCE TO MANAGERS
In order to promote widespread use, the model described in this paper for Pacific oyster nurseries is made available online: http://seaplusplus4.com/oysterspatbud.html. It allows to carry out simulations on several types of nursery systems.
This work describes the model user interface, including the menus for nursery setup (and seed characteristics), output for food requirements, output for optimum stock, and advanced settings (allows the user to modify the optimal feed concentration for oyster filtration). Examples on how to use the model for different case studies are also provided.
Model limitations include the following:
- Important effects that occur at smaller scale are not simulated in the model, e.g., changes in the water flow rate due to oyster size/densities or tank shape
- The option with bloom tanks assumes these are interconnected with the oyster-holding tank, which together are the simulated unit. In this case, the water flow is the water that enters from the outside (an adjacent ecosystem for instance) into the bloom tanks forced by tidal height or pumped
- The salinity effects on filtration rate are not simulated and thus it is assumed that water salinity is higher than 20
MODEL APPLICATION TO FARMS
In spite of the model simplification, it can still provide guidance for managing stock and food limitation in natural feeding oyster nurseries. It offers a wide range of possible scenarios in which the nursery operates. It provides guidance for the management of stocks and food limitation in naturally fed oyster nurseries. In addition, it also allows a quantification of the general rules concerning the spat holding capacity for a given nursery. Finally, the total biomass stock that can be maintained will depend on the quality of the spat.
The cost of producing a species like oyster for commercial purposes needs to be limited. The technique applied in this paper to get there is sound for oyster farmers. It is important to know all the biological and ecological aspects related to the good development of this species. The food aspect is a primordial resource in the growth of a species. Therefore, the model proposed in this study is useful to better understand what the essential nutrient inputs for the good development of the oyster are. However, there are many factors influencing the growth of these organisms and further study to refine the model may be required.
TO CONCLUDE …
The model:
- Presented provides an assessment of the seed stock limitations in an extensive commercial oyster nursery that can function with respect to food limitation.
- Provide valid indications on the limits of the maximum stock in a given nursery or on the food requirements of a given spat stock for optimal rearing conditions.
- Is intended for managers of commercial operations and can be used online.
- Can be developed based on feedback from the growers regarding its usefulness.
In addition, other features they consider important could be included, as well as other oyster species. We can also apply it on other biological models with a strong economic interest and whose physiology of the species is suitable for study in a controlled environment.
")
Mytilus edulis (Linnaeus, 1758)")
Ruditapes philippinarum (Adams et Reeve, 1850)This model is applicable to species whose production cycle can be controlled. Indeed, the model studied is a tool that tells us the maximum amount of food necessary for the proper development of the species. Therefore, it cannot be adapted to species that cannot be analyzed in a closed and controlled space. It should be noted that linking statistics to biology is a fundamental approach to evaluate and understand a species in the best possible way while including other parameters that may have a negative or positive effect on it. Furthermore, it would be interesting to extend this study to other oyster species and other organisms concerned by these culture systems. In addition, as the authors say, it would be interesting to consider the opinion, yields of shellfish farmers in order to improve the model for a better management aid.
This post is licensed under a Creative Commons Attribution-ShareAlike 4.0 International License.Pyramids, built by the Egyptians and reversed by sharksby Pierre Labourgade, Valentin Santanbien and Morgan Schler
Published by the October 5, 2020 on 8:28 AM
The case of a extreme inverted trophic pyramid of reef sharks supported by spawning groupers in Fakarava, French Polynesia
Predators play a key role in the structure and functioning of ecosystems (Paine 1966; Begon et al. 2006). Through food webs, the relationship between preys and predators is crucial in order to maintain a balance, including in marine ecosystems (Woodson et al. 2018). A trophic pyramid is a graphic representation designed to show the biomass at each level of the food chain. The lowest level starts with decomposers and the pyramid ends with top predators. This is called a pyramid because generally, the biomass in the lower levels turns out to be much higher than in the upper levels (Figure 1 A). However, in the marine environment, and in some remote and almost unoccupied areas, predators may dominate in terms of biomass, generating an inverted pyramid (Figure 1 B).
 and inverted (B) trophic pyramid")
Figure 1 Diagram of a normal (A) and inverted (B) trophic pyramidAggregations of grey reef sharks, Carcharhinus amblyrhynchos are observed on some reefs in the Indo-Pacific (Robbins 2006) (Figure 2). The southern pass of Fakarava atoll in French Polynesia has a population of around 600 individuals of this species (Mourier et al. 2016) (Figure 3). This makes it one of the few places to present such a large grouping. With such a large population on a reef channel of just over 1 kilometer, the area has up to three times the biomass per hectare documented for any other reef shark aggregation (Nadon et al. 2012). The biomass of predators is then much greater than preys, thus generating an inverted trophic pyramid. During this study, scientists tried to understand how those large group of sharks can survive when prey biomass is insufficient.

Figure 2. Aggregation of grey reef sharks
Figure 3. Panoramic view of Fakarava atollDuring the study period, video-assisted underwater visual surveys conducted across the pass allow the researchers to find that sharks population can represent up to 700 individuals. Then, scientists use bioenergetic models based on known value of parameters that influence energetics needs of shark-like “asymptotic length”, “growth rate” or “proportion of fish in the diet” to determine prey biomass needed for all the individuals. According to bioenergetic models, the food requirements to maintain that large population is approximately 90 tons of fish per year, which is not provided by the environment as it is. However, the pass is used as a breeding ground for many fish species, thereby reducing the prey-shark ratio. This means that the prey biomass will be much higher than that of sharks during these reproduction periods (Mourier et al. 2016), leading to frenetic predation behavior in the shark that will allow it to meet its energy needs (Robbins and Renaud 2016; Weideli, Mourier, and Planes 2015). Furthermore, the continuous presence of prey aggregation is ensured by the successive migration of different species to this site, in order to meet the metabolic demands of the shark population present (Craig 1998). With simulation-based on researcher bioenergetic model, sharks would not have enough energetic income after 75 days if other prey species didn’t migrate to the pass. There is, therefore, an idea of metapopulation where the exchange of individuals between populations in normal and inverted trophic pyramids ensures that the energy needs of each individual are met (Figure 4). This exchange of individuals between populations will allow the long-term maintenance of the species and, in the case presented here, of the shark.

Figure 3. Diagram of the transfer of potential prey for the shark between two normal pyramids and one inverted trophic pyramid via migratory flowsThe temporal aspect in the movement of individuals between populations is therefore important to be considered during the development of management and conservation measures. Indeed, if we want to ensure the sustainability of the grey reef shark in this pass, we must not only protect the habitat on-site, but also the original habitat of different species that come to reproduce in the pass. These species are indeed essential for the survival of sharks since they represent the only source of energy available during certain periods of the year.
Other cited articles:
This post is licensed under a Creative Commons Attribution-ShareAlike 4.0 International License.Spatial response of plaice and sole to climate changeby Arnaud Dupond and Alix Pascal
Published by the August 3, 2020 on 7:54 AM
Scientists admit that climate change is one of the main driving forces which change species distribution and abundance in many ecosystems.
In this case, a modification of abiotic variables can affect the “niche concept” and can also change species geographical distributions. For the marine environment, this notion of geographical dependence is important. Indeed, marine organisms show several distinct stages during their life and each of these stages evolve in a specific habitat.
The objective of this study was to use different models based on physiological aspects and environmental variables in order to estimate habitat occupation by plaice and sole under different climate change scenarios in the North Sea.
How to reach this objective?
To predict new habitats, researchers considered environmental variables and determined their effect on the food web, but also the effect of the food web on the water chemistry. To do that, the ecosystem model used functional groups of taxa. Their taxa are phytoplanktonic, planktonic and macrobenthic organisms. Some of them have a direct effect on the water chemistry and are regulated by other taxa. The food web is also used to quantify the availability of the habitat’s resources. Thanks, of this two types of model results fit more precisely reality of the distribution.
The sample strategy is built like this, data are collected daily on surface of 10x10km sin the North Sea.

Figure 1: Schematic simplification of the models used in the studiesResults of the study
The model of environmental variables shows the predictions for temperature and food conditions between 1989 and 2002. This data showed benthic production is concentrated along the southern coast during the year 1989, whereas in 2002 is concentrated in the Southern bight (figure 2).

Figure 2: Comparison of the benthic production between 1989 and 2002 in the North SeaAn important fact is that the temperature rate inside of which the growth is positive will change with the size of the fish and according to abundance of food (the more food is abundant the higher rate of temperature is). Indeed, bigger fish need higher temperature to grow optimally. Figure 3 defines the areas of maximum potential daily growth of each class size of plaices in 1989 at the left, and in 2002 at the right.

Figure 3: Comparison between the three size ranges of plaices and soles, of the speed growth in regard of two environmental parameters, the food availability and the temperatureThe results for maximum potential growth per day seem to give the same result as the estimate of average abundance. (Figure 4).

Figure 4: Comparison of the plaice and sole abundance distribution in the North SeaConclusion
For the plaice, migrations during different stages of life maximize their physiological performance during the summer season, in the winter, the adult’s distribution is determined by the best spawning habitat and shows maximisation of their fitness. Sole differs in their physiological traits and have a higher optimal growth temperature which explains the difference in life habitat. As for plaice, the area indicated high quality habitat for the different size class.
This study can predict the evolution of species distribution with a model of environmental changes and one of physiological changes but in our case, we can just explain data collected not the prediction made with the model.
Read the full study: Teal, L.R., van Hal, R., van Kooten, T., Ruardij, P. and Rijnsdorp, A.D. (2012), Bio‐energetics underpins the spatial response of North Sea plaice (Pleuronectes platessa L.) and sole (Solea solea L.) to climate change. Glob Change Biol, 18, 3291-3305. https://doi.org/10.1111/j.1365-2486.2012.02795.x
This post is licensed under a Creative Commons Attribution-ShareAlike 4.0 International License.Microplastics: no effect on the productivity of the marine environment?!by Amaelle Bisch and Anaelle Bouloy
Published by the July 6, 2020 on 2:45 PM
According to the paper: “Do microplastics affect marine ecosystem productivity?” by Troost et al. 2018, microplastics would have almost no effect on primary and secondary production, or at least this effect could not be demonstrated!
 But what are microplastics?
Plastics appeared at the beginning of the 20th century and quickly became indispensable in everyday life. Plastics are composed of polymers (long carbon chain) of synthetic or natural origin. Microplastics are plastic particles smaller than 5 mm (. There are two types of microplastics: primary (directly manufactured at this size) and secondary (resulting from the degradation of macroplastics). The major disadvantage of microplastics is that they are easily ingested by marine biota (2,3).
Primary production, the basic link in a long chain
Primary producers are at the base of the trophic chain. They are autotrophic organisms that produce their organic matter from a light (photosynthesis) or mineral source. In the marine environment, these organisms correspond to algae, phytoplankton and cyanobacteria and are the basis for zooplankton feeding. Zooplankton are secondary producers and heterotrophic organisms unable to synthesize their organic matter.

Phytoplankton
ZooplanktonHow can microplastics affect these organisms?
In most of laboratory experiments, the impacts showed on plankton, they were for primary producers an inhibition on the algae growth, chlorophyll content and photosynthesis (4,5,6). For zooplankton, it was observed a reduced food consumption and an increasing in energy consumption with a low allocation of this energy for growth (7,8). But these effects depend to the species of plankton and the nature of microplastics (9). However, are these observations noted in the laboratory really transposable to the ecosystem scale?
The models spoke...
The study by Troost et al. (1) shows, by means of modelling, that at the level of primary production (algal biomass) there is no significant impact of microplastics. Indeed, this can be explained by different theories: (i) environmental conditions (availability of nutrients and light) already strongly impact the growth of algae, (ii) a transport technique (advection) would provide some protection.
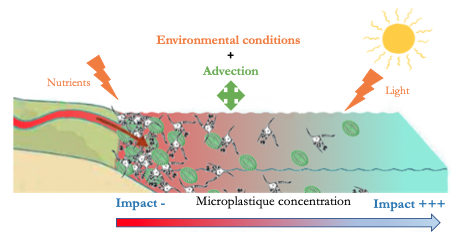
Concerning zooplankton, or secondary production, the impact of microplastics is considered low over the entire North Sea because the observed changes are both positive and negative and therefore compensate each other. Exposure to microplastics leads to changes in spatial patterns and strangely enough the impact is not greatest in areas with the highest concentration of microplastics. Surprising but not so much because this can be explained simply by the small concentrations of algae found in off-shore areas (areas with the least concentration of microplastics) making zooplankton more sensitive to any change.
And how they have managed to demonstrate that?
The difficulty lies in a successfully integration of the data observed in the laboratory into an ecosystem-scale model. They modelled biogeochemical transport, hydrodynamics, nutrient inputs from rivers, primary production, zooplankton biomass and also microplastic concentrations in the North Sea. In the end, the results obtained are only based on modelling and could not be verified in the field, so the conclusions should be "swallowed" with caution.
Cited articles
- Troost, A., Desclaux T., Leslie, A., Van Der Meulen, M., Dick Vethaak, A., 2018. Do microplastics affect marine ecosystem productivity? Marine Pollution Bulletin 135 (2018) 17–29
- Ivar do Sul, J., Costa, M.F., 2014. The present and future of microplastic pollution in the marine environment. Environ. Pollut. 185, 352–364. http://dx.doi.org/10.1016/j. envpol.2013.10.036.
- GESAMP, 2016. Sources, fate and effects of microplastics in the marine environment: part two of a global assessment. In: Kershaw, P.J., Rochmann, C.M. (Eds.), IMO/FAO/ UNESCO-IOC/UNIDO/WMO/IAEA/UN/ UNEP/UNDP Joint Group of Experts on the Scientific Aspects of Marine Environmental Protection. Rep. Stud. 2016pp. 220 GESAMP No. 93.
- Zhang, C., et al., 2017. Toxic effects of microplastic on marine microalgae Skeletonema costatum: interactions between microplastic and algae. Environ. Pollut. 220, 1282–1288.
- Sjollema, S.B., et al., 2016. Do plastic particles affect microalgal photosynthesis and growth? Aquat. Toxicol. 170, 259–261.
- Casado, M.P., et al., 2013. Ecotoxicological assessment of silica and polystyrene nano-particles assessed by a multitrophic test battery. Environ. Int. 51, 97–105.
- Watts, A.J., et al., 2015. Ingestion of plastic microfibers by the crab carcinus maenas and its effect on food consumption and energy balance. Environ. Sci. Technol. 49, 14597–14604.
- Van Cauwenberghe, L., et al., 2015. Microplastics are taken up by mussels (Mytilus edulis) and lugworms (Arenicola marina) living in natural habitats. Environ. Pollut. 199, 10–17.
- Wenfeng Wang, Hui Gao, Shuaichen Jin, Ruijing Li, Guangshui Na, 2019. The ecotoxicological effects of microplastics on aquatic food web, from primary producer to human: A review. Ecotoxicology and Environmental Safety 173, 110–117
This post is licensed under a Creative Commons Attribution-ShareAlike 4.0 International License.
Corals and algae, a relationship in danger: a model to predict their future! by Clara Dignan, Anna Gago and Anabelle Leblond
Published by the March 2, 2020 on 2:14 PM
 and normal branching coral (background). Keppel Islands, Great Barrier Reef")
Bleached branching coral (foreground) and normal branching coral (background). Keppel Islands, Great Barrier ReefCorals that come together to form coral reefs are shelter to 25% of our planet's marine life according to the WWF. This biodiversity is fundamental. It’s both a source of income and food, and it provides irreplaceable services to humanity. But today coral reefs are in danger. They are directly threatened by global warming. In forty years, 40% of the reefs have already disappeared and scientists agree that if nothing is done by 2050, all of them will be gone (Coral guardian).
Coral polyps and algae, an endosymbiotic relationship
Coral bleaching has now become a major global concern for the future of coral reefs. Temperature rise appears to be one of the main causes of bleaching, affecting growth, feeding and other ecological processes on reefs. This bleaching phenomenon is due to the expulsion of zooxanthellae, the symbiotic microalgae living in the tissues of the polyps (the coral is made up of a colony of polyps that participate in the making of its skeleton). These unicellular algae carry out photosynthesis and provide, for the most part, the energy that corals need to develop and grow. Exchanges between the polyp and the zooxanthellae mainly concern nitrogen, phosphorus, carbon and biosynthetic intermediates. The presence of zooxanthellae being responsible for the color of the colonies, bleaching is therefore the symptom of a coral which is no longer in symbiosis, which generally results in the death of the coral.

The coral-symbiont relationship and its interaction with the overlying water column.Prediction models
Since few year, scientists analyze corals and try to predict their bleaching evolution. In this aim, a collaboration between several organizations such as CSIRO have set up a first hydrodynamic, sedimentary and biogeochemical model called: « eReef ». This model simulates the environmental conditions as the temperature, the background light and the organic nutrient concentration of the Great Barrier Reef at several scales. It allows accurate prediction of factors influencing coral processes from satellite remote sensing images.
However, for more representative modelling, it is necessary to apply models that take into account the coral-symbiont relationship and the stress related to environmental variations. In this framework, Baird et al. have developed a model which, in parallel to the environmental conditions obtained from the « eReef » model, also takes into account essential parameters in the symbiotic process such as biomass and growth rate of zooxanthellae, pigment concentration, nutritional status as well as tolerance characteristics such as sensitivity to reactive oxygen concentration (oxidative stress).
")
The eReefs coupled hydrodynamic, sediment, optical, biogeochemical model. Orange labels represent components that either scatter or absorb light levels. (For a better understanding of the colour used and the abbreviations, the reader is referred to the web version of the article)Take home message
This coral bleaching model applied under realistic environmental conditions has the potential to generate more detailed predictions than satellite coral bleaching measurements. In addition to predicting coral bleaching, this model will now make it possible to evaluate management strategies, such as the introduction of temperature-tolerant individuals or species or localized shading.
Nevertheless, this model is still too simplistic to make real predictions. It is based only on the process of a single type of coral and macro-algae and does not take into account all phenomena related to bleaching. It is therefore seen as a step forward for science that could allow for future reevaluations of the effects of bleaching.
Bibliography
Albatrosses: the laziest ocean birds?by Manon Yerle
Published by the July 8, 2019 on 9:51 AM
Movement ecology is a new scientific discipline that studies the movement paradigm in the animal kingdom. The fact is: How foragers choose their hunting technics? Foragers are animals that need searching in wild food resources. Since 1960s foraging theories are studied over the world. It’s known that free-handing animals must maximize their energy gain in order to spend as little as energy possible to find and catch their preys. To better understand how this works, some scientists conducted a study about the foraging strategy of the wandering albatross (Diomedea exulans). In this study they integrate instantaneous energy budgets within the movement ecology.
 in sit-and-wait (SAW) foraging strategy. Credit: John Harrison")
Wandering albatross (Diomedea exulans) in sit-and-wait (SAW) foraging strategy. Credit: John HarrisonMaybe, you have already heard “albatrosses are always sitting on water”, “albatrosses are lazy birds” …In fact when you see one, most of the time, it’s resting on surface of the water and does NOTHING! Why is it doing that whereas it could be attacked by sharks? Moreover, water is very cold! To answer at this primordial question, the foraging strategy of the wandering albatross was studied and well characterised in the Southern Indian Ocean. Four strategies are known: foraging-in-flight (FII), area-restricted-search (ARS), sit-and-wait (SAW) and resting (RES). Strategies depend on external conditions like weather features or wind, etc… In the study, between 2002 and 2005, during brooding periods, 45 birds were tracked but prey data capture were available only for 18 foraging trips. Over 18 birds, only 5 were studied because they were complete for all data.

Albatross in FII foraging strategy. Credit: John HarrisonAuthors assumed that net energy gain equal to energy gain minus energy expenditure. Energy gain is estimated by prey capture data (stomach temperature and digestion time) and conversion factors corresponding to the diet of the wandering albatross. Energy expenditure is estimated with continuous measures of heart rates values during trips. Finally, total trip net energy is estimated by cumulating instantaneous net energy gain along the trip. Assuming external factors (wind speed and angle between flight and wind) affects foraging, they implement the flying cost model to provide energy expenditure estimates.
The most used foraging strategy is sit-and-wait because this strategy is better for the brooding period; they obtained higher net energetic gain when foraging trips are short. So, albatrosses aren’t lazy, but they are searching for food. Are their results available regarding fewer numbers of individuals? In statistical analyses it is assumed that results are available if the number of individuals is higher than 30, which is not the case here. Moreover, optimal models don’t work in wild life because there is always external factors that prevent it.
Whereas previous studies (Weimerskirch et al. 2005) identified FII strategy as the most optimal for long trips, our study identified another strategy for shorts trips, SAW. In fact, birds need to provision chicks frequently and that requires more energy than during incubation. Breeding stage defines the foraging strategy used. Another study should be managed during the incubation period implementing an instantaneous energy-budget model. Moreover, they should implement internal factors as thermoregulation that is more important in SAW for example. Now, we know how wandering albatrosses choose their foraging strategies. We can ask if SAW really is a good foraging strategy because albatrosses are more vulnerable against predators like tiger sharks.

This post is licensed under a Creative Commons Attribution-ShareAlike 4.0 International License.A new approach of modeling dissolved organic matter release by phytoplankton. Is it an improvement?by Bastien Mourguiart and Thomas Panarotto
Published by the April 12, 2019 on 6:53 PM
Phytoplankton is playing key roles in marine ecosystems. These microscopic plants are known, in particular, to be a part of the “Biological Pump”. Using photosynthesis as metabolism, it fixes carbon of the atmosphere to produce energy. This process reduces atmospheric concentration of CO2 and limits the greenhouse effect. It also produces oxygen indispensable to the life of many organisms.
Phytoplankton forms the basis of the marine food chain. Autotrophic organisms, they convert sunlight energy into chemical energy (food). This food constituted by molecules with carbon (organic matter) can pass directly along the food chain when zooplankton eats the phytoplankton and in turn are consumed by larger animals such as fishes, whales, squids, shellfishes and birds. Organic matter (OM) can also be released by phytoplankton in a dissolved form named dissolved organic matter (DOM). Organic matter can then be absorbed by bacteria and enter the main food chain when bacteria are eaten by zooplankton.
Heterotrophic prokaryotes (all animals) use carbon contained in DOM as a major source of energy. So, products excreted by phytoplankton are really important in the functioning of marine ecosystems and understand how DOM is released in the environment is essential.
Livanou et al. present in their article “A DEB-based approach of modeling dissolved organic matter release by phytoplankton” a new model to calculate DOM release by phytoplankton. They apply Dynamic Energy Budget (DEB) theory on phytoplankton cells for that. In this study, the metabolism theory leads to describe DOM fluxes, based on assumptions about energy uptake, storage, and utilization of N and C. The authors are mainly interested in how DOM is excreted by phytoplankton under different nitrate concentrations.
They calibrate and test the goodness of fit of the model using past laboratory data. In this previous experiment, others scientists (Flynn et al. 2008), measured DOM released by one species of phytoplankton with two phase of nutrient concentration: one with enough nitrate for all the individuals and one with nitrate in limitation. The results of DEB-Model fit well to experimental data according to Livanou et al. even it does not explain all the information: in the figure below, lines (the model) do not fit exactly the points (experimental data).

Figure 2 in Livanou et al.To conclude, they explain quickly that their model permit to describe how DOM is released. In no N-limitation condition, passive mode is used and DOM excreted is more accessible for bacteria. For N-limitation condition, DOM released cannot be used by bacteria and it tends to accumulate.
This study is maybe a step forward in comprehension of phytoplankton physiological mechanisms. However, in our opinion, it is not really useful to improve our understanding of energetic flows in the oceans. Moreover, the model was calibrated for only one of the thousand species of phytoplankton existing in nature. It should be calibrated for others species to catch up more processes which can change between species. The model can be more accurate catching up all the processes in this particular species too: the fitting test shows some differences from the experimental data (Figure 2). There is also limiting by the fact that only one nutrient is used as limiting nutrient: in reality, there can be more (Moore et al. 2013). To summarize, it needs very lot of work on this model to employ it in real ecosystems and be an improvement.
Other references:
This post is licensed under a Creative Commons Attribution-ShareAlike 4.0 International License.High throughput screening methods to assess pollutants effects: A relevant technique?by Alexandre Bijaye and Melody Fernandez
Published by the March 12, 2019 on 6:43 PM
The purpose of the paper written by Miller et al. in 2016 is to assess the effectiveness of HTS (High Throughput Screening) techniques to predict the effects of metal nanoparticles on a population of Isochrysis Galbana, a common species of phytoplankton.
High Throughout Screening is one of the newest techniques used in toxicology and which is planned to be implemented in biological and chemical sciences in the near future. Their technology is based on the analyzes of chemical compounds to be conducted in a short time. The affinity of biological structures which is related to the toxicity to be defined.
In this article, we’ll focus on nanoparticles: Engineered nanoparticles (ENPs) are actually an emerging form of metal contamination. These particles are widely used in biochemistry, engineering,… Four elements are studied in this paper: Ag, ZnO, CeO2 and CuO. The studied concentrations of each compound chosen were known to affect phytoplankton populations.
")
Silver nanoparticules (T. Theivasanthi/Wikimedia)The results showing a decline of the photosynthetic activity (PSII) are compared to the HTS tests results. DEBtox models are energycally and toxycodynamically balanced modelling techniques (DEBtox and TD) and are here used to evaluate the impact of ENPs.
First, the decline in photosynthetic activity is a good predictor. Phytoplankton are vulnerable to pollution, particularly because of their aptitude to accumulate contaminants. As a result, such a bioaccumulation can impact food webs integrity.
Isochrysis Galbana populations were cultured at 20°C in sterile seawater (at 34 per thousand of salinity). In these conditions, HTS techniques measured cellular lesions responding to a toxic agent, permitting here to measure the potential impacts of ENPs on organisms.
Four HTS tests were undertaken (based on the mitochondrial membrane potential, ROS occurence, (3) cellular efflux pump action and cell membranes permeability). These tests are based on fluorescence and cell health. The impact of metallic nanoparticles was also measured. However, the results obtained were not consistent enough to highlight responses to ENP exposure:
Non-HTS tests were performed by the measurement of the impact on photosynthetic efficiency. The metal concentrations were measured using the graphite furnace atomic absorption.
Fluorescence kinetics of chlorophyll was also measured with an amplitude modulated pulsed fluorometer. Then the maximum fluorescence yield was computed using WinControl Software. This the maximum fluorescence variation is assumed to be a measurement of the potential quantum yield of the PSII.
A clear decrease in the performance of the PSII was observed for all the ENP’s:
- A greater decrease was observed for ZnO
- Also, a notable decrease was measured for CuO, at low concentrations
- Finally, the presence CeO and Ag decreased the performances as well even though the decrease was the smoothest.
According to the authors, these results linked with the different dissolution rates that are specific to each compound. In this direction, Zn has a high dissolution rate, CuO and Ag dissolve very slowly and CeO has an undetectable dissolution rate.
As a conclusion by the authors, HTS methods can not be used to measure the impacts of metal particles because of their poor predictive power. So far, traditional ecotoxicological methods must be used.
With such results in mind, we also agree on this statement: the four tests led by the authors all brought different conclusions. As HTS methods rely on the affinity of biological structures which is often related to toxicity to be defined, the presence of cellular compensatory mechanisms could have masked cellular responses to ENPs expositions.
In conclusion, although HTS methods offer promising opportunities in the biological sciences (such as ecotoxicology), there are need for further investigation in this area before these techniques can be commonly adopted and used.
Cited study: Miller, Robert J., et al. (2016) Photosynthetic efficiency predicts toxic effects of metal nanomaterials in phytoplankton, Aquatic toxicology 183, 85-93.
This post is licensed under a Creative Commons Attribution-ShareAlike 4.0 International License.Identifying the optimal depth for mussel suspended culture in shallow and turbid environments.by Yann Godard and Louna Riem
Published by the February 1, 2019 on 4:52 PM
Bivalve aquaculture is commonly carried out in shallow water where there is an important influence of winds, tide and currents. These factors can lead to the remobilization of particulate matter which is an important source of food for bivalves. However, the concentration of the particulate matter in water can be minimized by the filtration capacity of high density cultured bivalves. In order to improve the productivity of cultured bivalves, it is important to take into account these different parameters. Indeed, it will help to know where is the best place for bivalve’s growth.

Skive Fjord mussel farms - https://northsearegion.eu/watercog/pilot-projects/skive-fjord-dk/A study conducted in a Fjord in Denmark suggests that the TPM (Total Paticulate Matter) in the environment of culture is very important for the growth of mussel. The autors have built two models to understand the mechanism:
- The first model try to give a pattern of the vertical distribution of resuspended materiel by including, among others, the particles concentration at 1m above the seafloor
- The second model allows seeing the growth mussel at different height in the water column and calculates growth rates. This is made under different scenario of food availability.
Both of these models allow determining the optimal localization of mussel in the water column for the better production.
Firstly, the authors have determined the characterization of seston in the long-term and in the short-term. They observe that there was important correlation between wind and TPM but with a lag of 9 hours. Thus, they say that the remobilization of particles is not depending of the wind in the farm but of the remobilization in another place in the fjord for the short-term seston characterization. These particles are then transported by water current until the Fjord. Moreover, a correlation is also observed between the chlorophyll concentration and the TPM but not between the water velocity and TPM.
For the long-term, they were able to highlight that the repartition of seston, and particulary phytoplankton in the water column was not homogeneous. There is a difference in concentration at the bottom and at the top with more phytoplankton at the surface (because of the lightening).
Secondly, the authors wanted to characterize the growth of mussels under different conditions of availability of food with the hypothesis that the concentration of phytoplankton is homogeneous in the water column. The results say that in reality, there is more phytoplankton in the surface, then, the growth in the top is not very well implemented in the model. They conclude that it is important to consider the position of bivalves in the water column for an optimal growth.
The dynamic energetic budget model shows that it is important to have a lot of phytoplankton and less detritus in order to get a better growth whatever the position of the culture. Moreover, this model allows showing that the variation of growth between the top and the bottom is only 2.6% which is negligible. They conclude this part by suggesting that “The reduced impact of height above the seafloor on mussel growth is related to the small contribution of resuspended material compared to the high background concentration of detrital matter”.
This study takes place in a Fjord where the conditions are highly variable (changes in the tide, current, wind…). This is not implemented in the model. Therefore, it could be interesting to add some hydrodynamics parameters in the model in order to adjust it. Moreover, to improve the model, it would be wise to include some biological mussel parameter like the energetic costs of pre-ingestive sorting and pseudofaeces production. This model could be experimented in different places and different moment to validate it.
This post is licensed under a Creative Commons Attribution-ShareAlike 4.0 International License.
Global change and climate-driven invasion of the Pacific oyster along European coasts: a bioenergetics modelling approachby Mélanie Gouaux and Lise Guégniard
Published by the January 8, 2019 on 3:20 PM
Environmental changes such as seawater warming, and coastal eutrophication have an impact on breeding, larval survival and recruitment of marine benthic species. Global change induces changes in the natural distributions of native species and facilitates the spread of non-native species. Nowadays, the spread of non-native species in marine ecosystems around the world is one of the most serious environmental concerns. In receiving ecosystems, consequences of biological invasions are readily identifiable when invasive species are ecosystem engineers such as polychaetes or bivalves.
Scientists of the French Research Institute for the Exploitation of the Sea and of the university of Nantes investigated how global change relates to the invasion of European coasts by a non-native marine invertebrate, the Pacific oyster Crassostrea gigas.
This species was introduced on the European coasts of the Atlantic at the end of the 19th century for shellfish culture purposes and is the main oyster species farmed in Europe today. In recent decades, the Pacific oyster has acquired invasive species status with the expansion of its biogeographic distribution along the northwestern European coast beyond its initial zone of introduction into sites breeding. Bourgneuf Bay on the French Atlantic coast was considered as the northern boundary of C. gigas expansion at the time of its introduction to Europe in the 1970s. From this latitudinal reference, variations in the spatial distribution of the C. gigas reproductive niche were analysed along the northwestern European coast from Gibraltar to Norway.

A bed of Pacific oyster Crassostrea gigas in the Netherlands - Bas Kers - CC BY-NC-SA 2.0Mechanistic models are valuable tools for this purpose, and modelling approaches are useful for gaining a quantitative understanding of the effects of environmental changes on marine communities, and predicting their responses to projected climatic trends.
The use of the IBM and DEB models has shown results at different scales, at the individual scale, at the Bourgneuf Bay scale and at the European scale.
At the individual level, the results showed interannual variability of the dry flesh mass (DFM). A loss of DFM is explained by a spawning event. There has been a significant increase in DFM and the number of oocytes in recent years. To explain these results, they studied the relationship between the environmental conditions in late spring and the characteristics of the oyster. Then they achieved positive relationships between DFM and phytoplankton. Likewise, between the number of accumulated oocytes and phytoplankton. Here, phytoplankton seems to be the cause of this increase of DFM and the number of oocytes in recent years for this species of oyster. Here, phytoplankton seems to be the cause of this increase of DFM and the number of oocytes in recent years for this species of oyster. Moreover, according to the individual model, the higher the temperature of the sea surface, the earlier the clutches (June-July). While a cooler sea surface temperature will result in late laying (August-September).
Then, they applied the same models to the bay of Bourgneuf. The results showed an increase in the temperature of the sea surface in the bay, but also the effects of the temperature of the water on the laying. Indeed, as at the individual scale, the high-water temperatures lead to prose spits and vice versa.
Results at the European level showed a change in the geographic limit of spawning habitat, regardless of phytoplankton concentration. In 1986, the limit was located at the level of the Loire estuary with a south-north spawning gradient, earlier in the south of Europe. In 2003, this limit moved completely to the north of Europe. This change can be explained by the global warming of the waters.
Other studies have highlighted other results. Indeed, using a Degree / day model, Ifermer has demonstrated the importance of the nutrient pool for egg laying. Indeed, in recent years, laying is actually late because of the low nutritional value of phytoplankton. The warming of the waters would therefore cause the loss of the oyster's nutrient pool and thus a delay in laying eggs.
This post is licensed under a Creative Commons Attribution-ShareAlike 4.0 International License.Time and concentration dependency in the potentially affected fraction of species: The case of hydrogen peroxide treatment of ballast waterby Marie-Adèle Dutertre and Maud Hautier
Published by the December 10, 2018 on 4:32 PM
Globalization and international trade made natural gates easier to cross for species. As a consequence, few species were able to travel long distance and settled in new habitats where they become invasive species.
More than 80% of industrialized goods in the world are transported by the oceans in container ships. In many cases, container ships is discharged in the destination port and go back empty. Whereas, the structure of this kind of ship does not allow them to travel empty and with stability. This is for a problem of stability that ballast exists. Since the 19th century, ballast with rocks was substitute with water. Before ships leave the port , water is loading in tank and at the destination port tanks are discharged.

http://www.seos-project.eu/modules/marinepollution/marinepollution-c04-p05.fr.htmlBallast water transport contribute to invasive species spreading. In order to fight against exotics species, waters ballast are treated with Hydrogen Peroxide (H2O2). But there is a question : how to be sure that ballast water is effective and is not toxic for the marine environment ? In order to evaluate the environmental impact of the treatment, a study has been conducted. Three taxa has been chosen, among them, two crustacean, two algae and one rotifera : C. volutator, A. salina, E. costatum, D. teriolecta, B. plicatilis. The authors of the study consider three dimensions : Hydrogen Peroxyde concentration, the effect of the Peroxide Hydrogen on organism and Hydrogen Peroxide exposure time. In the experiment, they made the tree dimensions varied and they considered as the final aim, the mortality, the immobility and the inactivation of the organism. The results are used in a mechanistic model which is based on the description of Dynamic Energy Budget theory. The DEB theory consists of a simple set of rules that specifies how organisms acquire energy and building blocks from their environment to fuel their life cycle. It is used to rely the observed effects and the hydrogen peroxide concentration in the experiments. The DEB-tox model allows to determine ECx — Effect Concentration — : the concentration which induces a response of x% between the baseline and maximum after a specified exposure time ; and the HCx — Hazardous Concentration — : the concentration which is dangerous for x% of the population. Thanks to this values, it is possible to determine the PAF — Potentially Affected Population— with means the part of an ecosystem potentially affected by a drug concentration. The results show an interspecific response variability with means different interspecific H2O2 sensibility. Sensibility is a combination between time exposure and the concentration. The conclusion of the study is that the hydrogen peroxide is effective for treating ballast water.
Concentrations, effects and time exposure were studied there. The choice of the five species is a wise choice as a result of the representativeness of a wide selection of sensibility which allows to extrapolate this results to other species and then estimate the effect of hydrogen peroxide treatment on other species present in water ballast. Whereas the aim of the study was to assess environmental risks of hydrogen peroxide treatment, and the obtained results here cannot be used to conclude regarding as the environmental risks.
To assess more precisely the risk, it is important to consider the hydrogen peroxide degradation and its potential impact on marine ecosystem. The H2O2 is oxygenated water which would rapidly be decomposed : 2H2O2 => 2H2O + O2. In this case, the hydrogen peroxide would not impact the environment.
Furthermore, sub-lethal effects are sufficient to reduce the viability of the organisms and for that, lower concentration of H2O2 and lower time exposure are sufficient. The purpose is to neutralize exotic species with lower environmental and economic costs. Moreover, in order to reduce again the hydrogen peroxide used quantity, other studies show the efficiency of using UV, Ozone, and ultrasound for neutralizing species. The hydrogen peroxide treatment can also be used with alkaline water which allows to obtain the same result with lower concentration and time exposure.
An other option is to establish regulated areas for discharging and to filter and to purify ballast water before discharging in the environment.
This post is licensed under a Creative Commons Attribution-ShareAlike 4.0 International License.Estimating relative energetic costs of human disturbance to killer whalesby Max Davesne and Quentin Marcon
Published by the November 9, 2018 on 10:22 AM
Some predators are valued by humans, either for their ecological or aesthetic attributes, whereas others are viewed as pests. Increasingly, applied ecologists are asked to consider effects of anthropogenic activities on valued predators (Ormerod 2002). This complexity becomes especially apparent when dealing with conservation and management of cetaceans (whales, dolphins and porpoises), which are long-lived and elusive study animals. Cetaceans are also exposed to a variety of both targeted and incidental human activities in the marine environment. Nowadays, the boat traffic is always increasing as the « whalewatching » and that can cause some trouble as we don’t really knows if that disturb the ecosystem.

Boat approching a killer whale - Mike Baird - CC BY 2.0This study examined the activities of ‘‘northern resident’’ killer whales (Orcinus orca) in Johnstone Strait, British Columbia, Canada, in July and August, from 1995 to 2002. Disturbance from boat traffic has been identified as a conservation concern for this population. This study aims to test whether or not the boat presence altered whale’s activities and want to estimate the energetic cost of this disturbance for the whales.
The time-activity budgets observed with respect to boat presence were converted to rough estimates of the energetic demand of free-ranging killer whales (Kriete 1995). Only Kriete’s data from Hyak (a 4733 kg adult male) and Yaka (a 2800 kg adult female) were used, rather than values for both adult and sub-adult subjects, because data on the sub-adult female were thought to be unreliable (Kriete 1995).

Behaviour change in the presence of boats and avoidance trend and decrease in the likelihood of rubbing in the presence of boats. From Williams et al. 2006. estimated decrease in energy intake")
There is an increase of 3% in global energetic budget and a decrease of rubbing budget from 17% to 3% and for the feeding from 13% to 10%. These lost feeding opportunities lead to a substantial (18%) estimated decrease in energy intakeThis study analyzed the behavioral responses of orcas in the presence of boats. However, the model does not implement the variability between individuals. For example the stress induced by the presence of boats and the physiological differences that this may imply.
Studies demonstrated that many bird species respond to tourism presence by shortening feeding bouts (Burger et al. 1997; Galicia and Baldassarre 1997; Ronconi and St Clair 2002). This has been found also in numerous studies of terrestrial mammals, where feeding activity is easier to observe than in free-ranging cetaceans.
This study only covered one of three killer whale ecotypes. The results of this Northern residents study are difficult to extrapolate to other ecotypes (Southern residents and Migrants).
This post is licensed under a Creative Commons Attribution-ShareAlike 4.0 International License.Temperature-dependent body size effects determine population responses to climate warmingby Alison Arraud and Laura Duran
Published by the July 5, 2018 on 1:55 PM
Up to now, neither the size nor the stage of the individual were considered to studying the population responses to climate warming. On 2014, a scientific group proposed another way to understand the temperature effects on fish populations. They improved the interaction effects of temperature-dependence with the size and the stage of fish on their energetic thresholds responses. Energetic thresholds themselves act on the dynamic of stade-structured population (e.g. parr, smolt, adult).
 - Roberto Pillon - CC BY 3.0 Unported")
Flathead mullet (Mugil cephalus) - Roberto Pillon - CC BY 3.0 UnportedFinally, this study found that increasing temperature could redistribute biomass across life stages and modify the regulation of the population by reworking the intra-specific competition. Other studies have shown that high temperature during ontogenesis can accelerate the development and growth of individuals or, give individuals of smaller sizes early maturation.
This study points out the importance of taking into account the interactions between temperature and size-specific (maturing, reproduction, etc.) that will lead to a set of behavioral responses that have consequences on the structuring of a population. This is all the more important in the context of global warming.
This post is licensed under a Creative Commons Attribution-ShareAlike 4.0 International License.


 and inverted (B) trophic pyramid")


")

