Oysters with a plastic flavor in your plates for your celebrations!by Léa Bascoul, Vincent Dumontet and Sophia Lestringuez
Published by the November 8, 2021 on 5:52 PM
For over half a century, global plastic production has increased exponentially. Plastics represent 50% to 80% of marine litter. Microplastics (MP) are derived from the degradation of larger plastic articles or directly produced as microparticles (< 5 mm). Oceans have a “funnel” effect concerning MP drained from rivers and streams, they concentrate pollution from fresh waters in the oceans. In pearl farming structures and equipment, the use of plastics is a source of pollution to the detriment of the lagoon ecosystem. Due to their ubiquitous and small dimensions, MP are likely to be ingested by many organisms and in particular by the oyster, Pinctada margaritifera (Figure 1), which is a species of ecological and commercial interest. So, the objective of the study is to assess the impact of these microplastics on the physiology of this oyster species from the pearl lagoon of Ahe atoll, in the waters of French Polynesia (Figure 2).

Figure 1: Pinctada margaritifera
Figure 2: Ahe atoll localisationIn order to assess the effects of these molecules, IFREMER from French Polynesia, recreated microcosms [1] where oysters are exposed to polystyrene microbeads. Indeed, polystyrene is one of the most widely used plastic polymers and the most found in marine ecosystems.
After two weeks of depuration, oysters, were divided into three treatments. For each, 24 oysters were exposed to polystyrene solutions for two months. These solutions were a mixture of polystyrene microbeads of different diameters (6 and 10 μm) at equal weight. A control was carried out without exposure to polystyrene. Each tank, kept homogeneous, was exposed for 12 hours a day to light and the physico-chemical parameters were kept constant. The microplastic solution was injected continuously into the tanks associated with a mixed diet of two microalgae (Tisochrysis lutea and Chaetoceros gracilis).

Figure 3: Experimental exposure device of oysters to microplasticsDuring the experiment (Figure 3), various parameters, like oxygen consumption, were measured to assess the different energy expenditure of the oyster. Expenses related to food (ingestion rate and assimilation efficiency), to growth (the scope for growth defined from the energy budget and the shell growth rate) as well as those allocated to reproduction (characterization gonad [2] size and analysis of gametogenesis [3]) are quantified in each experimental group and compared to the control. The measurements were carried out on eight oysters per treatment after one month and then at the end of the experiment.
This experiment made it possible to demonstrate that at low MP concentrations, pearl oysters suffer adverse consequences for the sustainability of their populations. In fact, the metabolic responses of a stressed organism can lead to an increase in an individual's energy costs, forcing the organism to sacrifice some of its energy normally allocated to functions, such as growth or reproduction.
In this classical and standardized experiment, the oysters exhibited a significant dose-dependent reduction in the “scope for growth” without however modifying the shell deposit rate. On the other hand, although the ingestion rates of the microalgae were not affected by the microplastics, for an equal volume of filtered water the assimilation of the microalgae is disturbed by the presence of the microplastics and the energy supplied by food is lower. This is either linked to interference in assimilation processes in the digestive tract or to indirect competition between algae and microplastics.
The fact that metabolic (respiration) rates are not impacted suggests that the only possibility for the oyster to cope with a decrease in available energy is to modify its gametogenesis and / or its reproductive effort. However, reproduction in P. margaritifera is continuous and requires a lot of energy. The results of the study show that reproductive effort is not affected but that gametogenesis is strongly impacted. Thus “small holes” in the gonadal tubules [4] are observed in oysters exposed to microplastics. They could therefore be the start of the phagocytosis [5] of germ cells initiated to recover energy (Figure 4).

Figure 4: Impact on P. margaritifera metabolismIn a few words, the pearl oyster exposed to MP for a period of two months maintains its metabolism and its vital functions to the detriment of its reproduction, and therefore the sustainability of its future population.
This study could also serve as a model for the MSFD [6] Technical Group Marine Litter to assess the effects of microplastic litter in biota (D10C3), because the effects observed on Pinctada margaritifera in the lagoon of French Polynesia must be the same as on other filter feeding bivalves in Europe. The European Technical Group Marine Litter could thus propose a regulation of waste at the European level and not only at the level of the lagoon of French Polynesia.
The experiment results should support decision-making on plastic waste management measures in Polynesian lagoons, especially in atolls that have decades of pearl culture history without waste regulation or clean-up. This work would provide the necessary information to local authorities to regulate pearl equipment and establish a waste management policy such as the collection and recycling of this equipment.
The aim of the study was to measure the impact of microplastics on the metabolism of Pinctada margaritifera. The team of researchers therefore sought to artificially recreate different levels of pollution in the laboratory. This methodology is suitable because it aims to recreate the pollution conditions possibly encountered in natural environments. To measure these different levels of pollution, the experiment is carried out at different concentrations. As for the various parameters measured to assess energy losses, they make it possible to identify, in a non-invasive manner, the functions (growth and reproduction) "sacrificed" to cope with the loss of energy. They also allow us to see if this loss of energy had an effect on the metabolism of oysters. The parameters monitored therefore seem consistent for this study and could be used for similar studies on other bivalve filter-feeding organisms. Experiments using this protocol could be considered in fresh waters with other types of bivalves such as the mussel pearl (Margaritifera margaritifera). Also, this study can be evaluated with a direct approach on oysters from pearl farms and over several generations.
In several years, oyster populations on a global scale could be impacted by pollution from microplastics … so, if there are no more oysters, what will we eat with our white wine?
[1] smaller version of ecosystem
[2] an animal organ in which gametes (a haploid germ cell, such as a spermatozoon or ovum) are produced
[3] gamete formation process
[4] organs of gametes excretion
[5] cellular defense process, destructive function of phagocytes
[6] Marine Strategy Framework Directive

This post is licensed under a Creative Commons Attribution-ShareAlike 4.0 International License.How does agricultural pollution affect estuarine health in the United Kingdom?by Sven Mellaza and Matia Pavkovic
Published by the October 4, 2021 on 4:39 PM
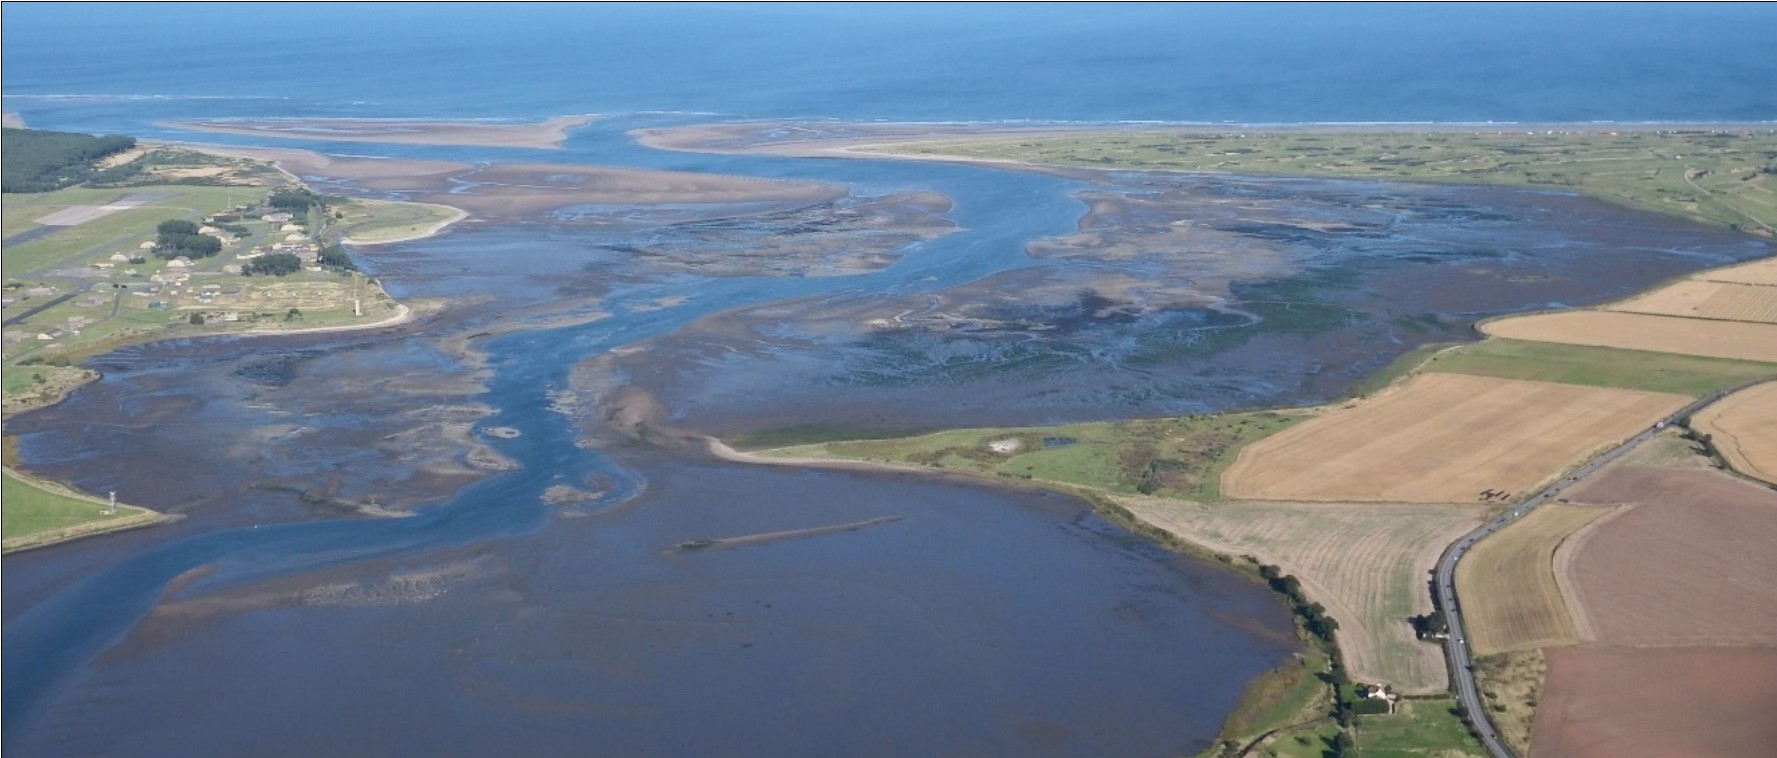
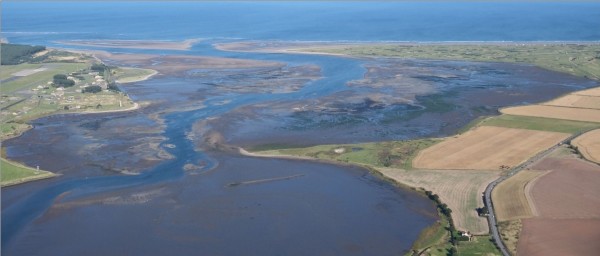
Estuaries are among the most productive ecosystems on the planet. These habitats deliver many services to humankind. They are characterized by wide ranges of water salinity, currents power and turbidity. To their natural stressors are added human disturbances that affect the natural system.
The rivers, from their sources to the sea, follow a long path through land fields. In a period of important rainfall, a large part of the land pollution defined by Nitrates and Phosphates is collected by the rivers and transported to estuaries. Consequently, the enrichment of the system modifies the relation equilibrium in the food chain; a rich and complex link between the organisms is the base of a healthy resilient ecosystem. The management application is crucial, so estuarine ecosystems can continue to deliver services and host rich life diversity.
Impact analyses of the pollution on the ecosystem
In this study, the scientist aimed to asses estuarine health by considering the relation between all the organisms. They have analyzed two estuaries systems from the United Kingdom. Tamara estuary is a medium-size complex located on the south-west coast of England; it stretches from Gunnislake weir to Plymouth sound. The second estuary, Eden, is smaller compare to the first one. It is positioned between the village of Guardbrige and the town of St Andrews on the East coast of Scotland.
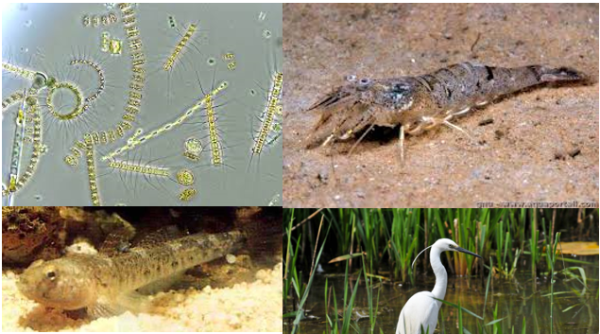
Since the 90’s, the two ecosystems have experienced major nutrient enrichment from the arable and livestock production. This pollution led to the ecosystem “eutrophication”, a biological phenomenon that can cause an increase of algal bloom and a decrease of oxygen concentration in habitats.
For this research, ecologists are using mathematical software called “Ecopath model”. The model is a widely used tool to identify and quantify major energy flow in the ecosystem, to visualize the important interaction between species, evaluate pollution and climate changes in aquatic ecosystems. This approach allows them to examine systems in their entirety to adjust management application.
The aim of this study is to analyze and compare food network structure of these two estuaries at different historical period of nutrient concentration. The results shows that Tamar estuary is 25% more active than Eden estuary in periods of high nutrients concentrations. The activity is defined by the number of matters flowing in the system. The scientists explain here the difference by the greater size and greater freshwater inputs from the rivers in Tamar estuary. The second indicator was the total biomass of the estuary. The productivity of the system decreases with the reduction of nutrients enrichment. Primary producer’s growth is stimulated by the extra nutriments, which improve their development and finally impact the upper trophic levels.
During pollution event, flow of nutrients increases, leading to degradation of the food-chain organization and structure. In addition, wider the estuaries are, slower it recovers from perturbations, especially looking at the trophic structure.
The Ecopath, Ecosim and Ecospace models are tools primely used to evaluate ecosystem impact of fisheries (Pauly et al. 2000). As it gets popular, these models are useful to evaluate trophic systems like estuaries. These well-known models can be useful to predict and analyze the effects of actual global changing. Nevertheless, a bunch of other models exist and are used to analyze trophic system like Bayesian-mixing model. Using different tools to study the same problematic permit comparison and can lead to different approaches.
Help! How do I manage my commercial oyster nursery?by Coline Arqué, Marylou Pourret and Robin Thibault
Published by the September 6, 2021 on 4:16 PM
Evaluation of food limitations in commercial oyster nurseries: an aid for managers
Oyster production provides an important number of ecosystem services (nutrient cycling, providing habitat for other marine species, ...). Furthermore, shellfish farming is promoted and recognized as providing social and economic benefits, as well as ecological benefits. Oyster growth and production depends on several factors such as temperature, salinity, freshwater flow/rainfall, current speed, density, feed concentration and phytoplankton species composition, feed sharing with other species and disease outbreaks. For this reason, modeling can be useful in understanding the feedback between agricultural and environmental systems and the effects on production. Mass balance models can help estimate the food requirements of a given spat stock.
Objectives:
- Develop and evaluate model for different culture structures using Pacific oyster spat
- Make the model available online for wider use
- Ensure it tackles two questions that arise when planning or managing an oyster nursery: how much food is required to sustain a given stock and for a typical range of food available in the surrounding environment, what is the maximum biomass that can be stocked
Why use the Pacific oyster?
")
Crassostrea gigas (Thunberg, 1793)- Strong Economic Interest: 4.4 million tons in 2003 (FAO)
- The cultivation is well suited: to small family businesses, cooperatives or regional industry
- The grow-out phase can be carried out by: relatively unskilled labor with minor investment in equipment and infrastructure
The overall goal of this model is to estimate the food inputs for a given stock biomass; and the maximum stock biomass for a given external food concentration.
Different parameters were considered in this model relied on the experiences of Langton and McKay (1976) ...
Level of food supply
Simulations of two feeding levels with an interval of 6 hours:
- Exp A : Exp A: daily intake of 180 algae cells/μL x 250 L of tank
- Exp B: 120 algae cells/μL x 250 L of tank
In addition, to mimic the experimental setting, the model application includes only one class of oysters, so that at each run of the model, the spat size is set to the same size obtained from the weekly observations of Langton and McKay (1976) for the 6:00/6:00 regime.
[Food]Nursery
Key parameter used in the model as the optimal concentration to be maintained in the production unit. [Food]nursery: minimum dietary concentration that maximizes intake OR optimal concentration for growth.
Temperature
Chosen according to other references on the subject. The temperature for the maximum clearance rate is approximately 19°C. Thus, the lower limit of the model is set at 4°C and the upper limit at 30°C.
The biomass of the stock was calculated by considering the density of 50 spat per liter, multiplied by the volume of the tank (250 L) and by the size of the seeds.

Conceptual model for the oyster nursery.The choice of a model that takes several parameters into account allows a rendering close to reality. This application is a useful tool for managers who can limit as much as possible the costs that are not essential for the good development of a species. Indeed, the aquaculture environment is a field with high socioeconomic stakes. Therefore, it is useful in the long term to find new management concepts for sustainable resource management.
RESULTS
Week 0
Week 2
Week 3
Following weeks
Exp A
Exp B
Exp A
Exp B
Exp A
Exp B
Feed supplied is much higher than the stock requirements
Feed level supplied is still enough
Oysters are fed less than the optimum
Feed level supplied is near the threshold
Feed level supplied does not meet the needs of oysters
lower spat weight for experiment B than for experiment A
These different growth rates measured in Exp A and B (Langton & McKay 1976) confirm the model's predictions of dietary limitation. The results of the model are also consistent with those of Langton and McKay (1976), which predicted that oyster spat are not diet-restricted during the first two weeks. The model outputs provide the feed requirements to ensure minimum concentration in the nursery. It also gives the maximum biomass that can be stored to ensure a minimum concentration in the nursery for optimized growth.
ASSISTANCE TO MANAGERS
In order to promote widespread use, the model described in this paper for Pacific oyster nurseries is made available online: http://seaplusplus4.com/oysterspatbud.html. It allows to carry out simulations on several types of nursery systems.
This work describes the model user interface, including the menus for nursery setup (and seed characteristics), output for food requirements, output for optimum stock, and advanced settings (allows the user to modify the optimal feed concentration for oyster filtration). Examples on how to use the model for different case studies are also provided.
Model limitations include the following:
- Important effects that occur at smaller scale are not simulated in the model, e.g., changes in the water flow rate due to oyster size/densities or tank shape
- The option with bloom tanks assumes these are interconnected with the oyster-holding tank, which together are the simulated unit. In this case, the water flow is the water that enters from the outside (an adjacent ecosystem for instance) into the bloom tanks forced by tidal height or pumped
- The salinity effects on filtration rate are not simulated and thus it is assumed that water salinity is higher than 20
MODEL APPLICATION TO FARMS
In spite of the model simplification, it can still provide guidance for managing stock and food limitation in natural feeding oyster nurseries. It offers a wide range of possible scenarios in which the nursery operates. It provides guidance for the management of stocks and food limitation in naturally fed oyster nurseries. In addition, it also allows a quantification of the general rules concerning the spat holding capacity for a given nursery. Finally, the total biomass stock that can be maintained will depend on the quality of the spat.
The cost of producing a species like oyster for commercial purposes needs to be limited. The technique applied in this paper to get there is sound for oyster farmers. It is important to know all the biological and ecological aspects related to the good development of this species. The food aspect is a primordial resource in the growth of a species. Therefore, the model proposed in this study is useful to better understand what the essential nutrient inputs for the good development of the oyster are. However, there are many factors influencing the growth of these organisms and further study to refine the model may be required.
TO CONCLUDE …
The model:
- Presented provides an assessment of the seed stock limitations in an extensive commercial oyster nursery that can function with respect to food limitation.
- Provide valid indications on the limits of the maximum stock in a given nursery or on the food requirements of a given spat stock for optimal rearing conditions.
- Is intended for managers of commercial operations and can be used online.
- Can be developed based on feedback from the growers regarding its usefulness.
In addition, other features they consider important could be included, as well as other oyster species. We can also apply it on other biological models with a strong economic interest and whose physiology of the species is suitable for study in a controlled environment.
")
Mytilus edulis (Linnaeus, 1758)")
Ruditapes philippinarum (Adams et Reeve, 1850)This model is applicable to species whose production cycle can be controlled. Indeed, the model studied is a tool that tells us the maximum amount of food necessary for the proper development of the species. Therefore, it cannot be adapted to species that cannot be analyzed in a closed and controlled space. It should be noted that linking statistics to biology is a fundamental approach to evaluate and understand a species in the best possible way while including other parameters that may have a negative or positive effect on it. Furthermore, it would be interesting to extend this study to other oyster species and other organisms concerned by these culture systems. In addition, as the authors say, it would be interesting to consider the opinion, yields of shellfish farmers in order to improve the model for a better management aid.
This post is licensed under a Creative Commons Attribution-ShareAlike 4.0 International License.How raising snails allows to better understand the dynamics of a parasite?by Thomas Boyer and Thibault Dindart
Published by the July 19, 2021 on 9:38 AM
The analysis of epidemiological dynamics depends on host and parasite interactions. But these interactions fluctuate because hosts and parasites are heterogeneous entities that exist in dynamic environments. Resource availability is a powerful environmental constraint of intra-host infection dynamics (temporal patterns of growth, reproduction, parasite production and survival).
In this study, researchers developed, parameterized and validated an explicit resource infection dynamics model by incorporating a parasitism module in the energy balance theory. The mechanisms explained are the multivariate dynamic responses of the human parasite Schistosoma mansoni and its intermediate host snail to resource variation and host density. This parasite is widespread in Africa and inter-tropical America. Worldwide, more than 200 million people are infected with it, 9 million suffering from its symptoms, which cause more than 200,000 deaths every year. It tends to have erratic localizations (liver, spleen) and the accumulation in these organs of lost eggs makes the severity of the infection.
The most common symptoms are diarrhea and even dysentery. Complications can appear such as rectal prolapse, fistulas, occlusion, appendicitis.
To do this, they have parameterized the model using an experiment that manipulates food resources and follows the growth, reproduction, parasite production and survival of snail hosts. The model is then validated by simulating the dynamics of infection for host individuals undergoing different levels of intraspecific competition and comparing these predictions with the results of another experiment that manipulated host and resource density, and hence the intensity of resource competition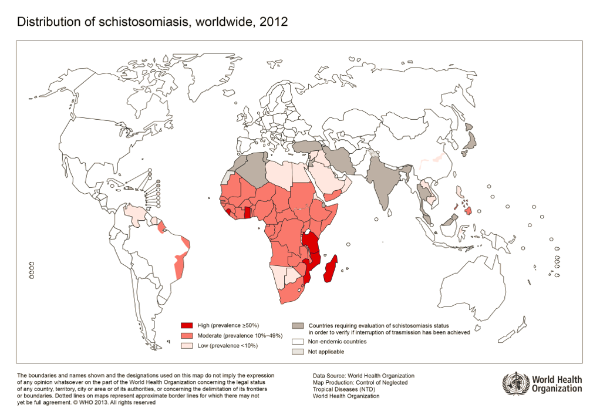
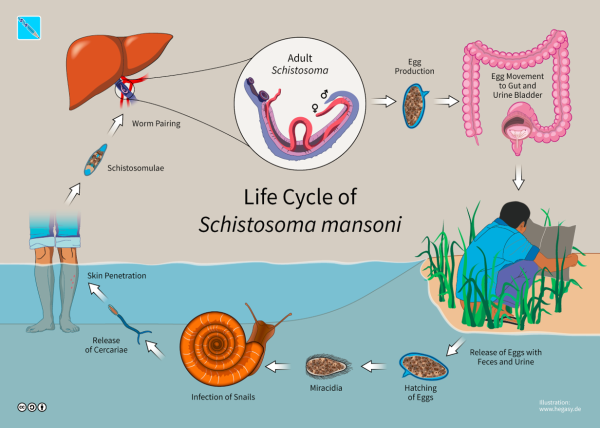
This bioenergy perspective suggests that variation in resource availability and competition could explain the infective dynamics of this parasite. To begin with, total cercaria production could be low when snail densities are low (because there are few infected snails) or when snail densities are high (if competition limits per capita parasite production). This potential relationship between snail density and the risk of human exposure could be the reason for the success or failure of current and proposed methods of schistosome control, which depend on reducing the density of snail vectors by molluscicides or predators. If resource competition in natural snail populations is strong enough, then snail reduction programmes could backfire, as reducing intermediate host densities could free the remaining hosts from resource competition, thereby increasing parasite production rates per host.
To conclude this bio-energetic model seems to indicate that the fight against the parasite Schistosoma mansoni begins with the regulation of snail populations (first host of the cycle). In order to better regulate this infectious dynamics, measures must be taken collectively between the countries concerned and must be directed towards a total reduction of snails or a limitation by intra-species competition. This model would establish priority levels of parasite infection for certain areas and would be followed by measures to control the parasite. A first measure would be the installation of pipelines to prevent the release of infected faeces into watercourses.
This post is licensed under a Creative Commons Attribution-ShareAlike 4.0 International License.Water, a limiting factor in lizard activities and distributionby Alice Loubet-Laouina
Published by the June 28, 2021 on 3:32 PM
Water is an increasingly scarce resource for us, so we can ask ourselves: When will it be for animals? How will they react: flee, adapt, evolve?
Predicting the effects of climate change on biodiversity is an ecological objective in conservation management. Here we are interested in water restriction role on activities and distribution on ectotherms with the mechanistic niche model.
Who am I

Photograph by Olivier Cardona, 2013My name is Tiliqua rugosa or Sleepy lizard.I am an ectotherm. I explain: I don't produce heat, so I need the sun to warm me up.
I live in Australia.
I measure 40 to 45 mm.
I live for 50 years in the wild!
I love to eat flowers, fruits, and the leaves of annual plants.
I can lose more than 70% of my body water despite being adapted to the desert.
What is a mechanistic niche model?
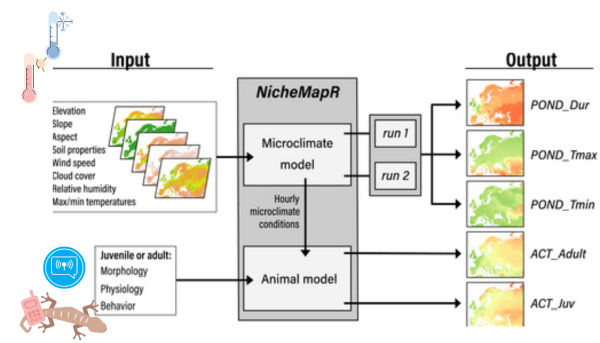
So, the study scientists use this model with environmental and biological data of the Tiliqua rugosa. These data create Microclimate and Animal models. This allows us to understand how climate change affected species with a complex life cycle. This model makes it possible to make predictions on the distribution of animals. The same scientists used this method for another study (Enriquez-Urzelai et al. 2019).
Biological activities
When we talk about the biological cycle, we are talking about growth and reproduction activities. These activities require energy. Organisms have to make a trade-off between spending and storing energy.
The consequences of water restriction
When lizards only have access to water through their food or rainfall, their activities are reduced to the maximum to limit their dehydration and keep their energy. So Sleepy lizards hide in their burrows. They nest in a burrow up to 60 cm deep.
Water is a limiting factor in reproduction. According to two simulations, lizards reproduce little in the center and northeast of Australia.

Estimation of net reproductive rateClimate change
To predict long-term evolution, we can use general circulation models in combination with mechanistic niche models. Therefore, it is interesting to compare different scenarios. Scenarios of the general circulation model1 can complement our niche model.
For the most part, water restriction is not a limiting factor for lizards. By running six scenarios under the assumption of water restriction, we find that the reproduction rate remains constant within the current ranges. The ACCESS 1.3 and GDFLCM3 Scenarios are exceptions.

Estimation of different scenariosSpecies will be affected by climate change because it will depend on future precipitation patterns. Global warming could therefore cause increased dehydration regardless of rainfall variations.
1 General circulation model: statistics of several environmental factors allowing to make predictions according to different scenarios developed by countries.
This post is licensed under a Creative Commons Attribution-ShareAlike 4.0 International License.
When a macaque has the choice between two lianasby Marie Delbasty and Julie Viana
Published by the May 10, 2021 on 8:00 AM
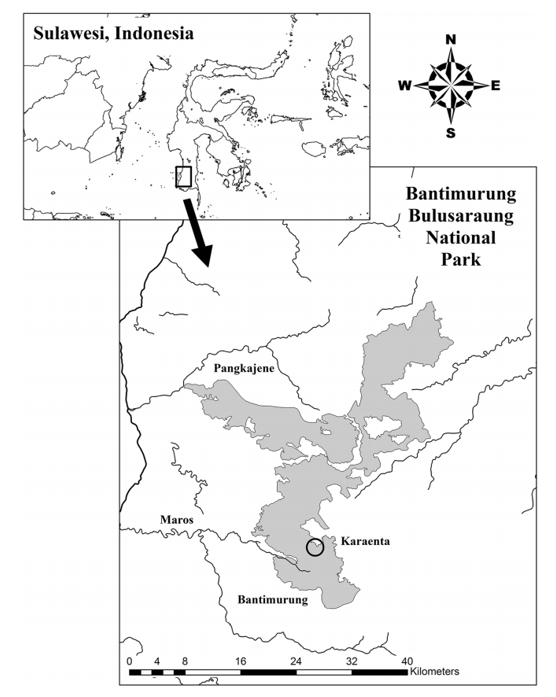
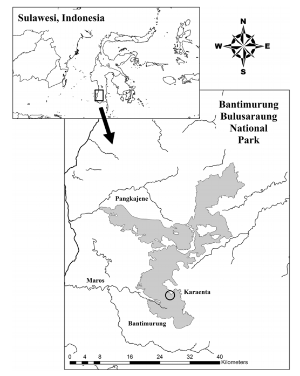
Two populations of moor macaques (Macaca maura) were studied in their natural environment in South Sulawesi, Indonesia in order to understand their use of two different habitats in karst forest.
Moor macaque is a species currently classified as "endangered" by the IUCN, mainly due to the disturbance and fragmentation of its habitat. That is why, in order to develop adequate conservation plans and management strategies, it is essential to study the patterns of habitat use in relation to the distribution of essential food resources.
Concerning the two types of habitat, they were characterized according to the vegetation present and its abundance as well as the topography and the presence of any trace of human activity.
The two habitats of this forest are in fact distinguished in two essential aspects:
The forest situated at the highest altitude with a steep slope, has few food resources but is not accessible to humans
vs.
The gently sloping forest, rich in resources but frequented by humans.

In order to carry out this study, each group of macaques was observed after having been accustomed to the presence of the scientists. The largest group consisted of about 30 individuals while the smallest group consisted of 18 macaques. The behaviour of the smallest group was studied from June to November 2016 while the largest group was studied from September 2014 to February 2015. Behavioural activities were defined as feeding, foraging, locomotion, social interactions and resting.
Although both habitats are used on a daily basis by each population, the analysis revealed that for both groups, the only behaviour that differed primarily between the two habitat types was time spent feeding. They spent more time feeding in the more food-rich forest habitat. The larger group spent more time overall in the food-rich forest while the smaller group spent more time in the food-poor forest.
The habitat with fewer resources is more of a refuge area for the macaques as they have no real predators and humans are the main threat. The larger group's use of a more productive but riskier habitat may be due to its history of provisioning, which may have allowed its individuals to have less fear of encountering humans. On the other hand, the individuals of the other group have never experienced provisioning. Another possible explanation is group size. Indeed, individuals in the larger group have less need to be vigilant because of their numbers, compared to the smaller group. In addition, the larger group might dominate the other group from a competitive point of view and thus be given priority for benefiting from resources.
In this context, macaques seem to be ecologically flexible, able to exploit the karst forest as a whole and to cope with human disturbance. It is important to protect the forest to allow the species to persist as habitat fragmentation threatens its survival. Thus, the management of this area would consist of balancing the needs of humans and macaques, and one of the solutions could be to educate local people on the protection of the species.
In a global context of loss of many species, the ideal would be to be able to leave in peace those for whom this is possible. Indeed, it seems preferable not to allow humans to access this area for the good of these macaques especially since this area is probably home to most of the remaining populations. Indeed, forest habitat with more food resources is a crucial part of the landscape for the survival of moor macaques in southern Sulawesi.
Thus, a question then arises:
would it be possible to let these macaques enjoy their habitats in peace while moving from one liana to another like Tarzan and Jane? To be continued…
Read the full study: Albani A., Cutini M., Germani L., Riley E. P., Oka Ngakan P. and Carosi M. (2020) Activity budget, home range, and habitat use of moor macaques (Macaca maura) in the karst forest of South Sulawesi, Indonesia. Primates 61, 673–684 (https://doi.org/10.1007/s10329-020-00811-8).
This post is licensed under a Creative Commons Attribution-ShareAlike 4.0 International License.Does food quality increases moult organism vulnerability to pollutant impacts? by Charlotte Couedel, Axel Rochaud and Stellia Sebihi
Published by the April 27, 2021 on 9:06 AM
Today's ecotoxicology
For a long time, ecotoxicology focused on the lethal effects of pollutants, with increased individual mortality translating into smaller population size or population extinction. There has been a shift from the study of lethal doses to the impact of smaller doses on more specific processes such as physiology and behaviour (Rand and Petrocelli, 1985; Døving, 1991). The article deals with the effect of pollutants on moulting.
Possible use of ecotoxicology (the case of the article)
Pollutants are an environmental factor causing stress in individuals. Lack of resources is another factor. For this reason, the study attempts to demonstrate and quantify the impact of food quality on the resistance to pollutants of moulting organisms.
Hypotheses of the effect of the diet on the assimilation and detoxification of pollutants
When a pollutant is assimilated by an organism, the body sets up the detoxification system, but it requires energy. Food allows the assimilation of energy by organisms. Good quality of food makes an individual capable of accumulating the energy necessary to ensure vital functions. An organism with energy from good quality food, should be able to activate an effective detoxification. Thanks to this detoxification, the body should be less impacted by pollutants. The study seeks to demonstrate whether this is true.

Hypotheses illustrationThe interest of the biological model
Gammaridae are macro-invertebrates that are mainly detritus feeders. They feed on detritus, corpses, living or decaying plants. Moreover, they are at the base of the human food chain as they are often industrially bred as fish food. Gammaridae are used to determine the biological quality of watercourses. They are rather pollution tolerant organisms but are nevertheless affected by pollution. Could the physiological changes noticed in Gammaridae be noticed in humans?

A picture of two GammaridaeWay to understand the effects
The experiment is designed to evaluate single and combined effects of leaf litter stoichiometric quality and Cd exposure on G. fossarum survival and growth. Phosphorus (P) is used as the nutrient in leaf litter. Cadmium (Cd) is used as the pollutant. Phosphorus (P) is a nutrient naturally present in the Gammaridae's food, in this case, leaf litter. Also, industrial activities are often sources of cadmium released into aquatic environments. The main route of exposure to cadmium (Cd) is through the ingestion of contaminated water and food, so Gammaridae is particularly exposed to this type of pollutant.

The experiment design144 microcosms were performed for each of the 3 levels of Cd concentrations (0 ; 0.35 ; 0.7). For each group, 72 microcosms were realised with Sycamore discs and 72 with Alder discs. It allows to observe the effect in different conditions. Then, among these 72 microcosms, three batches of 24 have been realized. The first batch is a control batch where the composition of the litter was not modified. The second batch was a P- batch, where the litter was deficient in phosphorus and therefore in nutritional value (and which does not allow individuals to extract a lot of energy). Finally, the third lot was P+, it was enriched in phosphorus, the nutritional value is very good.
Several metrics were measured to validate the initial hypotheses. The metrics were chosen for their relevance to evaluate organisms sensitivity to resources quality (leaf species and P content) and pollutant (Cd concentration in water): Cd bioaccumulation and survival rate. But also for their ecological importance: time-to-death, mass growth, time to moult and feeding rate.
Results to remember
- The Gammaridae's moult frequency and growth is amplified by a nutrient-rich diet (P+).
- A presence of pollutants (cadmium) in the Gammaridae’s life site reduces their growth and raise their probability of death.
- A nutrient-rich diet amplified effects of cadmium.
- If we make the connection: The higher quality of food ressources, the more moulting there is and the greater the effect of cadmium. So moulting makes Gammaridae vulnerable to pollutants.
- Species sensitivity to pollutants might be underestimated in ecosystems facing both nutrient constraint and pollutant.

Schematization of the main resultsWhat to infer from this experiment.
The presence of pollutants in the water causes problems in the survival of Gammaridae. Ecotoxicologists are well aware of the bioaccumulation of pollutants in the food chain. As a result, a predator will be more contaminated by the pollutants than is prey. Indeed, predators will keep in them the majority of the pollutants present in their prey. Thus, humans present in the upper part of the trophic chain will be much more contaminated than the Gammare.
So why discharge pollutants into the water? Let's drink it directly!
This post is licensed under a Creative Commons Attribution-ShareAlike 4.0 International License.