Use of dynamic energy budget and individual based models to simulate the dynamics of cultivated oyster populationsby Maxime Rochet and Jean-Baptiste Valerdi
Published by the October 8, 2018 on 12:45 PM
This paper deals with a test of Dynamic Energy Budget (DEB) apply for predictions of the oyster Crassostrea gigas production in Thau Lagoon. The DEB model is based on physiological and environmental parameters, he predict the growth at indivual level. In the case of oyster production the prediction must be applicate at the cohort levels, its why they choose to integrate the DEB model into a population dynamics concept. Population model choose its the IBM (Indivifual Based Model) method, the equations are used for the predict the harvested production and the stocks in place (total number of individuals). The advantage of this integration its to assess the effect of ecosystem changes on oyster production.

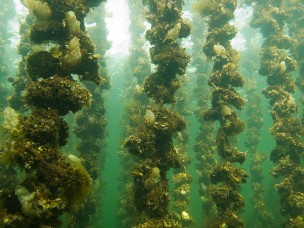
Oyster farming in the Thau Lagoon - Olivier Pessin - CC BY-SA 3.0The models recently used (DEB) have been compared with a more common prediction tool. The partial differential equation (PDE) are empirical equations used for the growth prediction between different class and simulate by individual total mass. This equation are more straightforward than the DEB-IBM models but they use only a single variable to represent individual growth. The DEB model integrate two variable of calibration, the other parameters of the differents equations were estimated from independent datasets using comprehensive studies of oyster growth and ecophysiology under controled conditions. The calibrated parameters are the chlorophyll a concentration proxy of the phytoplacton biomass (principal food of oysters) and the température linked to assimilation and maintenance rates. This technique modelise by this way the indivdual capatcity of food assimilation and the allocation of energy between energical reserve, structural tissues ans reproductive structure and maintenance. To be more likelihood a growth variability showing variability between individuals have been implanted. Some variability have been implanted into the prediction of PDE method and the DEB-IBM model. This variability was integrate by diffusion to reproduce the variability between individual growth in the PDE and by Xk (half saturation coefficient) variability in the DEB-IBM case.
The results of the differents simulations have proved a good capacity for the DEB-IBM model to predict the stocks and the harvest productions. The data estimated are close to the observed. He have to advantages to be generic, easy to etablish by the low number of measurables parameters. With the results showed in the study (see figure below) his capacity to take account of the environmment variables have been proved too . The limits are detectable in his sensivity to the variability and the large number of parameters estimated can induce in error.
From Bacher & Gangnery 2006.The comparison of the two models have show the effect of the variability in the predictions values. The values predicted by the DEB-IBM model look closer to the observation than the PDE predictions. For exemple the harvestes productions have been estimated earlier by the PDE method than the DEB-IBM, so the modelisation of DEB parameters can influe strongly the dynamic population and the production previsions.

This post is licensed under a Creative Commons Attribution-ShareAlike 4.0 International License.


